August 20, 2025 a 11:31 am


📊 GPN: Dividend Analysis - Global Payments Inc.
Global Payments Inc. (GPN) has demonstrated a consistent dividend growth trajectory, supported by robust fundamentals and strategic financial management. With an established track record of dividends over the past 25 years and a relatively low payout ratio, the company indicates resilience and commitment towards shareholder returns. Moreover, the company’s financial ratios suggest a sound capital structure, underscoring its capacity to sustain and potentially enhance its dividend yield.
📁 Overview
Assessing the broader context, Global Payments Inc. operates within a competitive sector characterized by dynamic shifts in technology and customer expectations. The following table highlights the key aspects of its dividend profile:
| Metric | Details |
|---|---|
| Sector | Financial Technology |
| Dividend Yield | 1.15 % |
| Current Dividend per Share | 0.99 USD |
| Dividend History | 25 years |
| Last Cut or Suspension | None |
📈 Dividend History
Analyzing the dividend history offers insights into Global Payments Inc.’s dedication to delivering consistent returns. The longevity of its dividend payments underscores its strategic stability and financial prudence.
| Year | Dividend per Share (USD) |
|---|---|
| 2025 | 0.75 |
| 2024 | 1.00 |
| 2023 | 1.00 |
| 2022 | 1.00 |
| 2021 | 0.89 |
📉 Dividend Growth
The effectiveness of a company’s dividend strategy can often be gauged by its growth over time. Growth rates reflect both shareholder confidence and financial well-being, informing investors about the future prospect of dividends.
| Time | Growth |
|---|---|
| 3 years | 3.96 % |
| 5 years | 34.76 % |
The average dividend growth is 34.76 % over 5 years. This shows moderate but steady dividend growth.
🗣️ Payout Ratio
A critical metric, the dividend payout ratio informs investors about the sustainability of dividend payments. Evaluating EPS-based and Free Cash Flow-based ratios reveals insights into operational stability and strategic efficiency.
| Key Figure | Ratio |
|---|---|
| EPS-based | 16.94 % |
| Free Cash Flow-based | 7.71 % |
These payout ratios suggest a conservative approach where the company effectively maintains a cushion to manage adverse economic conditions, preserving capital for growth and new opportunities.
💰 Cashflow & Capital Efficiency
Cashflow analysis provides a window into the financial underpinnings of a company, revealing its ability to cover dividends, reinvest in growth, and mitigate risk. The following metrics underscore capital utilization efficiency:
| Year | 2022 | 2023 | 2024 |
|---|---|---|---|
| Free Cash Flow Yield | 5.96 % | 4.80 % | 10.01 % |
| Earnings Yield | 0.41 % | 2.97 % | 5.50 % |
| CAPEX to Operating Cash Flow | 27.43 % | 29.27 % | 19.10 % |
| Stock-based Compensation to Revenue | 1.82 % | 2.16 % | 1.63 % |
| Free Cash Flow / Operating Cash Flow Ratio | 72.57 % | 70.73 % | 80.90 % |
The positive trends in cash flow efficiency and stock-based compensation to total revenue delineate prudent management priorities, ensuring long-term shareholder value enhancement.
📉 Balance Sheet & Leverage Analysis
Analyzing leverage and balance sheet metrics allows investors to gauge financial stability and debt management efficacy, informing decisions surrounding risk exposure and growth potential.
| Year | 2022 | 2023 | 2024 |
|---|---|---|---|
| Debt-to-Equity | 0.64 | 0.76 | 0.75 |
| Debt-to-Assets | 0.32 | 0.34 | 0.36 |
| Debt-to-Capital | 0.39 | 0.43 | 0.43 |
| Net Debt to EBITDA | 5.06 | 4.24 | 3.24 |
| Current Ratio | 0.92 | 0.99 | 0.97 |
| Quick Ratio | 0.92 | 0.99 | 0.97 |
| Financial Leverage | 2.01 | 2.20 | 2.10 |
Exemplifying fiscal discipline, Global Payments Inc.’s leverage metrics underscore manageable debt levels relative to equity and intrinsic growth capabilities, indicating robustness as well as potential for future refinancing flexibility.
🗣️ Fundamental Strength & Profitability
Assessing profitability and fundamental strength is essential for understanding operational efficiencies and long-term sustainability. The following metrics highlight the company’s performance capabilities:
| Year | 2022 | 2023 | 2024 |
|---|---|---|---|
| Return on Equity | 0.50 % | 4.29 % | 7.05 % |
| Return on Assets | 0.25 % | 1.95 % | 3.35 % |
| Margins: Net | 1.24 % | 10.22 % | 15.54 % |
| Margins: EBIT | 7.27 % | 18.96 % | 24.77 % |
| Margins: EBITDA | 27.05 % | 37.36 % | 43.56 % |
| Margins: Gross | 57.90 % | 61.39 % | 62.79 % |
| Research & Development to Revenue | 0 % | 0 % | 0 % |
This array of profitability metrics confirms an overarching trend towards sustainable growth and strategic profit maximization, ensuring improved investor confidence and attractive financial returns.
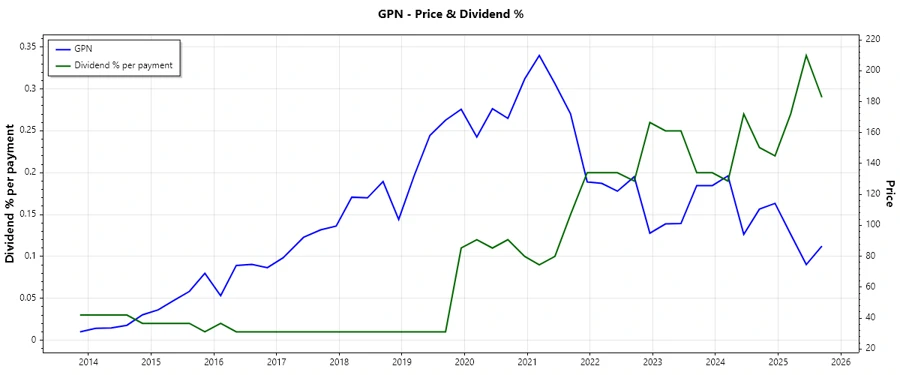
📈 Price Development
📊 Dividend Scoring System
| Criteria | Score | Bar |
|---|---|---|
| Dividend yield | 3 | |
| Dividend Stability | 4 | |
| Dividend growth | 4 | |
| Payout ratio | 4 | |
| Financial stability | 3 | |
| Dividend continuity | 5 | |
| Cashflow Coverage | 4 | |
| Balance Sheet Quality | 4 |
Total Score: 31/40
⚠️ Rating
Based on the analysis, Global Payments Inc. exhibits solid potential as a dividend-paying investment, underscored by its strong fundamentals and stable payout history. The stock is suitable for investors seeking steady dividend income and moderate growth potential. While financial stability remains robust, ongoing monitoring of leverage levels and market dynamics is recommended.
Smart Data Insight
Master the Perfect Entry & Exit for this Stock
Don't leave your profits to chance. Historically, this stock follows specific seasonal patterns that institutional traders use to maximize returns.
- ✅ Identify the "Golden Buying Window"
- ✅ Avoid high-risk correction cycles
- ✅ Backtested data from the last 20+ years