November 03, 2025 a 08:15 am
GPC: Trend and Support & Resistance Analysis - Genuine Parts Company
Genuine Parts Company (GPC) operates in the distribution of automotive and industrial replacement parts across a global supply chain. Over the past few months, the stock has shown substantial volatility, reflective of the market conditions. Understanding key levels of support and resistance alongside trend movements is crucial for investors looking to navigate GPC's stock performance. This analysis provides insights into recent trends and trading zones that may influence future price movements.
Trend Analysis
| Date | Close Price | Trend |
|---|---|---|
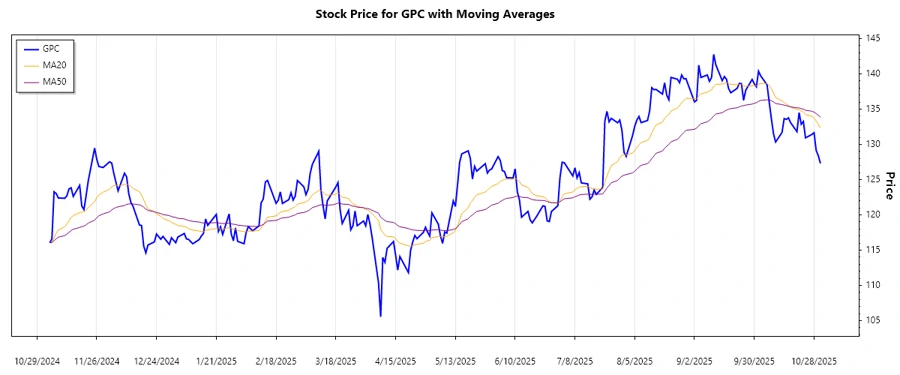
| 2025-10-31 | 127.31 | ▼ |
| 2025-10-30 | 128.40 | ▼ |
| 2025-10-29 | 129.15 | ▼ |
| 2025-10-28 | 131.66 | ▲ |
| 2025-10-27 | 131.42 | ▲ |
| 2025-10-24 | 130.93 | ▲ |
| 2025-10-23 | 133.26 | ▲ |
The EMA20 is currently below the EMA50, suggesting the existence of a downward trend. This indicates bearish momentum, where selling pressure dominates. Monitoring the gap between these averages will be crucial in identifying potential reversal zones.
Support and Resistance
| Zone Type | From | To |
|---|---|---|
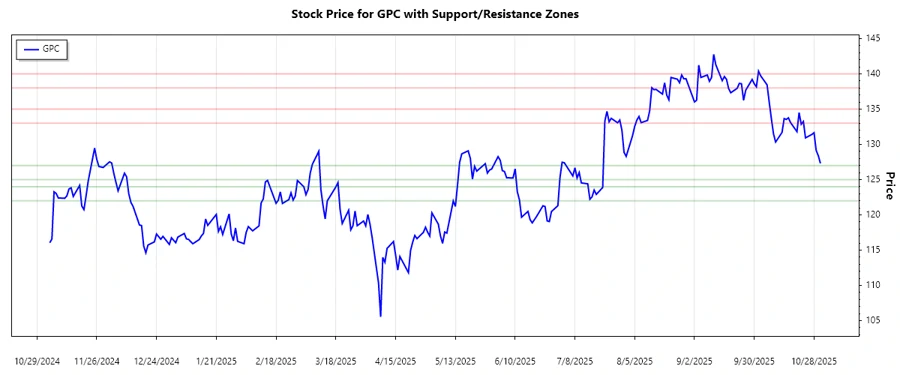
| Resistance 1 | 133.00 | 135.00 |
| Resistance 2 | 138.00 | 140.00 |
| Support 1 | 125.00 | 127.00 |
| Support 2 | 122.00 | 124.00 |
The current price is nearing the support zone between 125.00 and 127.00. If the price holds above this range, it may act as a springboard for bullish recovery. However, a breach would increase downward momentum significantly.
In conclusion, Genuine Parts Company's stock is witnessing a short-term bearish trend. The technical indicators highlight potential downside ahead unless support zones hold firm against selling pressure. For investors, watching the key levels will be pivotal. Analysts should look for reversal signals or deeper corrections for strategic entry points.
Smart Data Insight
Master the Perfect Entry & Exit for this Stock
Don't leave your profits to chance. Historically, this stock follows specific seasonal patterns that institutional traders use to maximize returns.
- ✅ Identify the "Golden Buying Window"
- ✅ Avoid high-risk correction cycles
- ✅ Backtested data from the last 20+ years