August 24, 2025 a 01:15 pm
GPC: Trend and Support & Resistance Analysis - Genuine Parts Company
The Genuine Parts Company (GPC) is witnessing an upward trend over the most recent months, with the stock showing signs of resilience in the market. Having a long-standing history in the distribution of automotive and industrial parts, these recent price movements can be attributed to the robust demand in these segments. The analysis suggests that the stock is currently navigating key support and resistance levels, indicating potential breakout or consolidation phases. Watching these zones closely is crucial for investors who are seeking lucrative entry or exit points. The company's diverse portfolio and international presence provide added stability, despite market fluctuations.
Trend Analysis
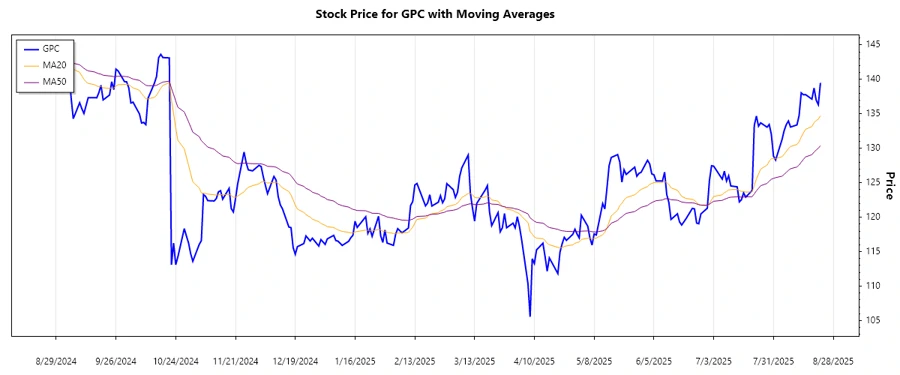
The recent analysis of GPC's closing prices indicates a consistent upward movement, with the EMA20 surpassing the EMA50 in the latest data, indicating a strong upward trend. Over the past few weeks, the stock price has shown relative strength and positive momentum.
| Date | Closing Price | Trend |
|---|---|---|
| 2025-08-22 | 139.50 | ▲ Uptrend |
| 2025-08-21 | 136.33 | ▲ Uptrend |
| 2025-08-20 | 136.99 | ▲ Uptrend |
| 2025-08-19 | 138.75 | ▲ Uptrend |
| 2025-08-18 | 137.14 | ▲ Uptrend |
| 2025-08-15 | 137.80 | ▲ Uptrend |
| 2025-08-14 | 137.77 | ▲ Uptrend |
In conclusion, the consistent breach of the EMA50 by the EMA20 underscores a solid upward momentum, suggesting a potential continuation of this trend.
Support and Resistance
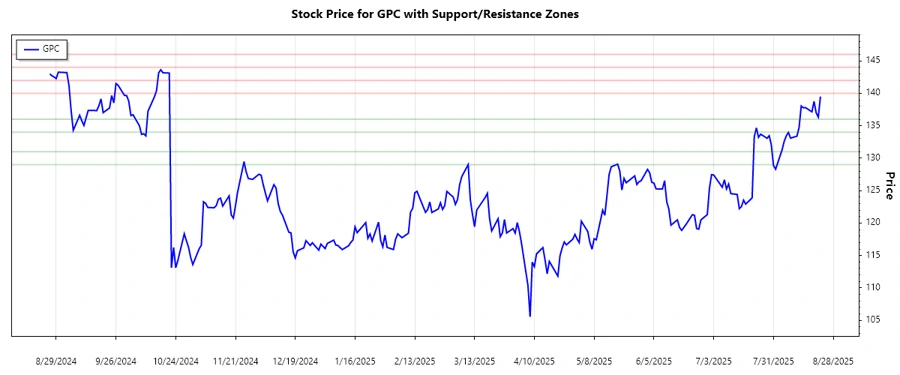
The analysis of historical price data reveals significant support and resistance levels for GPC. Identifying these levels helps in predicting price movements and potential breakouts.
| Zone Type | From | To |
|---|---|---|
| Support Zone 1 | 134.00 | 136.00 |
| Support Zone 2 | 129.00 | 131.00 |
| Resistance Zone 1 | 140.00 | 142.00 |
| Resistance Zone 2 | 144.00 | 146.00 |
Currently, the stock is nearing the resistance zone of 140.00 to 142.00, which indicates a potential for a breakout or reversal, depending on the market sentiments.
Conclusion
The upward trend in GPC is a positive indication for investors, suggesting that the stock may continue to appreciate. Nevertheless, being close to resistance zones warrants caution, as price reversals can occur. Investors should consider the company's strong market position and diversified offerings, which mitigate risks. The support levels provide safety nets, while a breakout from resistance levels could signal further rallies. Continuous monitoring of the EMA indicators and price movements in the identified zones will be crucial for making informed decisions.
Smart Data Insight
Master the Perfect Entry & Exit for this Stock
Don't leave your profits to chance. Historically, this stock follows specific seasonal patterns that institutional traders use to maximize returns.
- ✅ Identify the "Golden Buying Window"
- ✅ Avoid high-risk correction cycles
- ✅ Backtested data from the last 20+ years