May 21, 2026 a 03:15 pm
GPC: Fibonacci Analysis - Genuine Parts Company
Genuine Parts Company (GPC) is a major distributor in the automotive and industrial parts sectors. The stock has seen significant movements recently, with the latest data indicating a developing pattern that may influence future price action. Investors should consider both the company's strong market presence and the potential risks in a volatile global market. Understanding the technical factors at play through Fibonacci analysis can be pivotal in making informed decisions.
Fibonacci Analysis
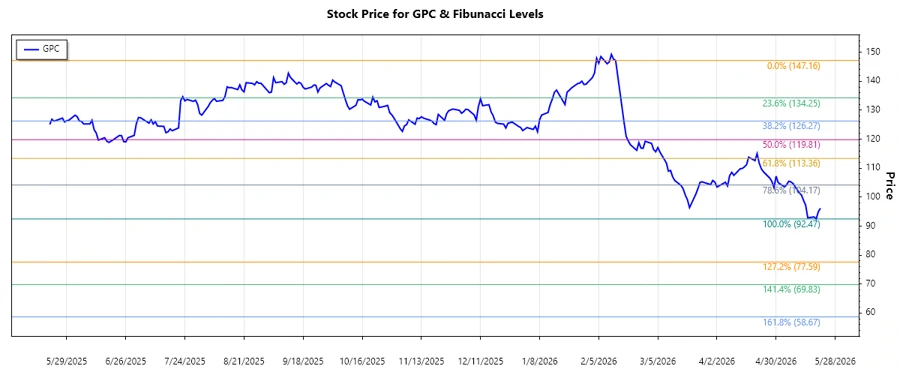
Based on the recent stock data, Genuine Parts Company has experienced a dominant downward trend. Utilizing Fibonacci retracement, significant levels are calculated to predict potential reversal points.
| Trend Analysis | Details |
|---|---|
| Start Date | 2026-02-13 |
| End Date | 2026-05-21 |
| High Point (Price/Date) | $147.16 on 2026-02-12 |
| Low Point (Price/Date) | $92.47 on 2026-05-19 |
| Fibonacci Level | Level Price |
|---|---|
| 0.236 | $108.43 |
| 0.382 | $115.92 |
| 0.5 | $119.815 |
| 0.618 | $123.71 |
| 0.786 | $129.26 |
The current market price lies within the retracement zone of 0.236. Technically, this level may act as potential support, leading to a short-term bounce in the stock's price.
Conclusion
Analyzing the data, the Genuine Parts Company appears to be facing a notable correction following its peaks earlier in the year. While the stock's retracement to the 0.236 levels suggests potential stabilization, caution is advised as further decreases could test deeper support levels. For investors, this period might present an opportunity to assess entry points given the strong fundamentals but should account for broader market conditions. Risks include possible continued volatility and underlying economic factors that could impact industrial and automotive markets globally.
Smart Data Insight
Master the Perfect Entry & Exit for this Stock
Don't leave your profits to chance. Historically, this stock follows specific seasonal patterns that institutional traders use to maximize returns.
- ✅ Identify the "Golden Buying Window"
- ✅ Avoid high-risk correction cycles
- ✅ Backtested data from the last 20+ years