
July 17, 2026 a 02:46 am

GPC: Dividend Analysis - Genuine Parts Company
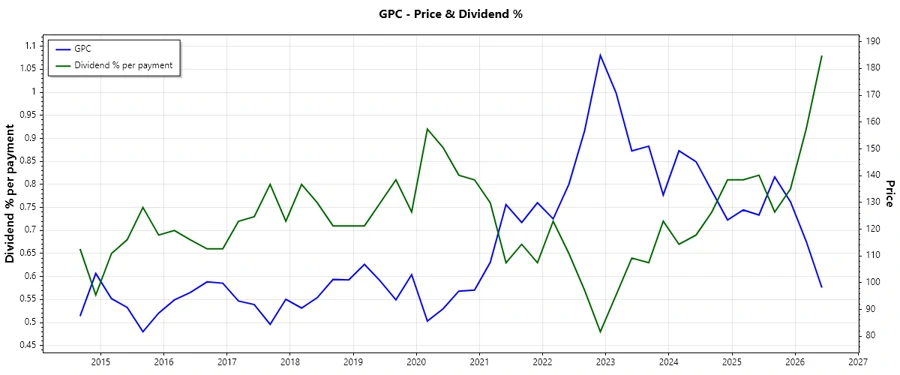
Genuine Parts Company boasts an impressive dividend history of 44 years, highlighting its long-term commitment to returning capital to shareholders. With a current dividend yield of 4.26%, it provides an attractive income stream for investors. However, the remarkably high EPS payout ratio calls for cautious assessment of future dividend sustainability. The company's modest dividend growth over the past five years indicates stable but not aggressive increases, aligning with its mature industry profile.
📊 Overview
Genuine Parts Company operates in the Industrials sector, known for delivering steady returns through economic cycles. Its current dividend yield of 4.26% positions it as a robust income investment. The company has sustained its dividend for 44 years, a testament to its operational stability. However, the high EPS payout ratio of 929.43% suggests potential risk, warranting close monitoring of earnings and cash flow metrics.
| Attribute | Value |
|---|---|
| Sector | Industrials |
| Dividend Yield | 4.26% |
| Current Dividend per Share | 4.06 USD |
| Dividend History | 44 years |
| Last Cut or Suspension | None |
🗣️ Dividend History
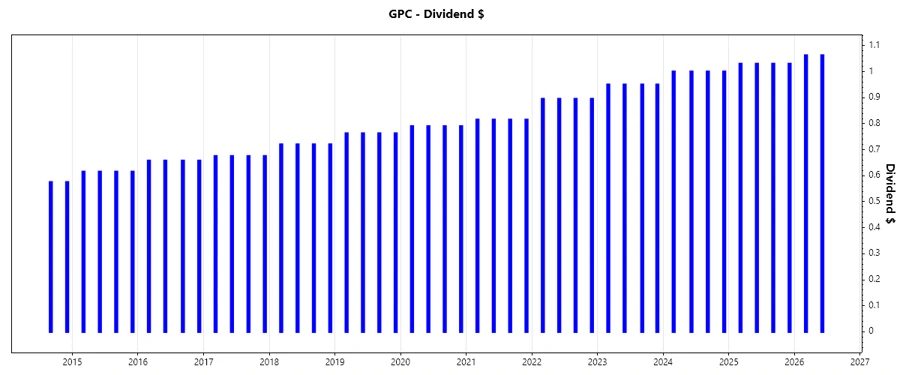
The consistency in Genuine Parts Company's dividend payments over 44 years underscores its reliability in providing shareholder value. Such stability is crucial for investors seeking regular income, particularly in volatile markets. Analyzing the history helps forecast future payouts and assess management's commitment to dividends.
| Year | Dividend per Share (USD) |
|---|---|
| 2026 | 2.13 |
| 2025 | 4.12 |
| 2024 | 4.00 |
| 2023 | 3.80 |
| 2022 | 3.58 |
📈 Dividend Growth
Modest dividend growth of 4.79% over three years and 5.45% over five years reflects Genuine Parts Company's steady approach. This gradual increase indicates the company's conservative capital allocation strategy, prioritizing sustainability over aggressive expansion. Investors should view this as a stable long-term growth opportunity rather than seeking short-term gains.
| Time | Growth |
|---|---|
| 3 years | 4.79% |
| 5 years | 5.45% |
The average dividend growth is 5.45% over 5 years. This shows moderate but steady dividend growth.
📉 Payout Ratio
Assessing dividend sustainability, Genuine Parts Company's EPS-based payout ratio at 929.43% raises red flags, suggesting dividends are not fully covered by earnings. The FCF-based payout ratio of 103.03% also exceeds 100%, indicating reliance on financial flexibility for dividend payments. Investors should closely monitor these metrics as they might signal future adjustments in dividend policy.
| Key figure | Ratio |
|---|---|
| EPS-based | 929.43% |
| Free cash flow-based | 103.03% |
The alarming EPS payout ratio suggests potential unsustainability. Continuous evaluation of cash flow and profit margins is imperative to ensure dividend security.
✅ Cashflow & Capital Efficiency
Evaluating Genuine Parts Company's financial health, a Free Cash Flow Yield of 3.13% indicates positive cash generation relative to enterprise value. However, the CAPEX to Operating Cash Flow and Stock-based Compensation metrics require prudent management for maintaining efficiency. The overall cash flow stability, reflected in a 47.25% Free Cash Flow to Operating Cash Flow Ratio, supports its dividend payouts but calls for strategic oversight.
| Metric | 2023 | 2024 | 2025 |
|---|---|---|---|
| Free Cash Flow Yield | 4.75% | 4.21% | 2.46% |
| Earnings Yield | 6.77% | 5.56% | 0.39% |
| CAPEX to Operating Cash Flow | 35.71% | 45.34% | 52.75% |
| Stock-based Compensation to Revenue | 0.25% | 0.17% | 0.20% |
| Free Cash Flow / Operating Cash Flow Ratio | 64.29% | 54.66% | 47.25% |
While cash flow generation remains sound, maintaining careful capital allocation strategies is essential to enhance long-term financial resilience.
⚠️ Balance Sheet & Leverage Analysis
Genuine Parts Company's balance sheet depicts a robust yet leveraged profile, with a Debt-to-Equity ratio of 1.87 in 2025, reflecting significant use of debt. This could amplify financial risk, especially amid economic uncertainties. The Current and Quick Ratios demonstrate adequate liquidity, while the Net Debt to EBITDA underscore a capacity to service debt, albeit with cautious leverage management.
| Metric | 2023 | 2024 | 2025 |
|---|---|---|---|
| Debt-to-Equity | 1.11 | 1.32 | 1.87 |
| Debt-to-Assets | 27.19% | 29.78% | 39.79% |
| Debt-to-Capital | 52.61% | 56.97% | 65.17% |
| Net Debt to EBITDA | 1.75 | 3.13 | 10.35 |
| Current Ratio | 1.23 | 1.16 | 1.08 |
| Quick Ratio | 0.63 | 0.51 | 0.46 |
| Financial Leverage | 4.08 | 4.45 | 4.70 |
The company's financial structure suggests a balanced approach, emphasizing leverage utilization for operational capital and growth. Nevertheless, prudent debt management remains crucial.
📝 Fundamental Strength & Profitability
Analyzing profitability, Genuine Parts Company exhibits solid fundamentals, with a 29.91% Return on Equity in 2023, reflecting effective shareholder capital utilization. Margins remain healthy across net, EBIT, EBITDA, and gross metrics, showcasing operational efficiency. However, the absence of R&D investment suggests limited focus on innovation-driven growth.
| Metric | 2023 | 2024 | 2025 |
|---|---|---|---|
| Return on Equity | 29.91% | 20.84% | 1.49% |
| Return on Assets | 7.33% | 4.69% | 0.32% |
| Margins: Net | 5.70% | 3.85% | 0.27% |
| EBIT | 7.82% | 5.42% | 0.89% |
| EBITDA | 9.34% | 7.16% | 3.10% |
| Gross | 35.90% | 36.29% | 34.58% |
| R&D to Revenue | 0% | 0% | 0% |
While profitability metrics appear strong, innovation could drive future competitive advantage, supplementing existing financial strengths.
📊 Price Development
🏆 Dividend Scoring System
| Criteria | Score | |
|---|---|---|
| Dividend Yield | 4 | |
| Dividend Stability | 5 | |
| Dividend Growth | 3 | |
| Payout Ratio | 2 | |
| Financial Stability | 3 | |
| Dividend Continuity | 5 | |
| Cashflow Coverage | 3 | |
| Balance Sheet Quality | 4 |
Total Score: 29/40
🔍 Rating
Genuine Parts Company is a stable income investment, ideal for conservative investors seeking reliable dividends. Nonetheless, attention to high payout ratios and leveraging strategies is essential for maintaining fiscal health. As part of a diversified portfolio, it provides consistent yield, albeit with cautious growth prospects. Current scores suggest a moderate recommendation based on dividend reliability and overall financial outlook.
Smart Data Insight
Master the Perfect Entry & Exit for this Stock
Don't leave your profits to chance. Historically, this stock follows specific seasonal patterns that institutional traders use to maximize returns.
- ✅ Identify the "Golden Buying Window"
- ✅ Avoid high-risk correction cycles
- ✅ Backtested data from the last 20+ years