
June 24, 2026 a 11:31 am
GPC: Dividend Analysis - Genuine Parts Company
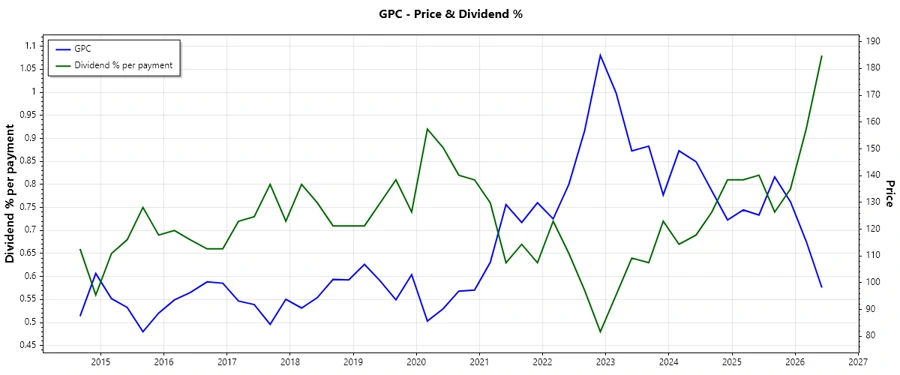
The Genuine Parts Company (GPC) has a commendable dividend profile with a consistent history of payments. With an attractive dividend yield and a moderate growth pattern, GPC is positioned as a reliable income-generating investment for dividend-seeking investors. Not only does GPC maintain a solid track record of 44 years of uninterrupted dividend history, but it also showcases a potential for future growth. However, careful assessment of payout ratios and future earning capacities is necessary to ensure long-term sustainability.
📊 Overview
GPC operates in a competitive industry yet showcases remarkable resilience in dividend disbursals. Analyzing its sector-specific strategies provides insights into its ability to maintain and potentially grow its dividends.
| Metric | Value |
|---|---|
| Sector | Industry |
| Dividend Yield | 4.26% |
| Current Dividend per Share | $4.06 |
| Dividend History | 44 years |
| Last Cut or Suspension | None |
🗣️ Dividend History
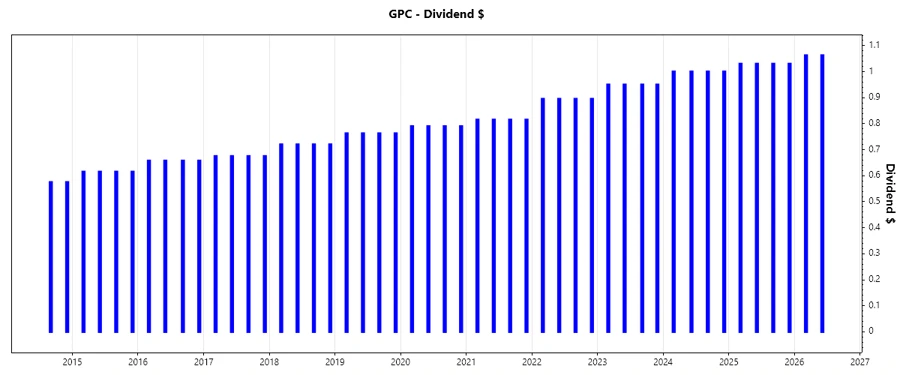
Understanding the dividend history of GPC is crucial as it reflects the management's commitment to returning value to shareholders. A longer history often correlates with stability and confidence in future payouts.
| Year | Dividend per Share (USD) |
|---|---|
| 2026 | 2.1250 |
| 2025 | 4.12 |
| 2024 | 4 |
| 2023 | 3.80 |
| 2022 | 3.58 |
📈 Dividend Growth
Growth in dividends per share indicates that the company is expanding and confident in its ability to generate future cash flows. Monitoring growth over time allows investors to project potential income growth.
| Time | Growth |
|---|---|
| 3 years | 4.79% |
| 5 years | 5.45% |
The average dividend growth is 5.45% over 5 years. This shows moderate but steady dividend growth, which can be appealing for investors looking for gradual income increase.
✅ Payout Ratio
Payout ratios help assess whether a company can maintain its current dividend level without stretching its profits or cash flows. A high payout ratio might indicate limited reinvestment opportunities.
| Key Figure | Ratio |
|---|---|
| EPS-based | 929.43% |
| Free Cash Flow-based | 103.03% |
The EPS-based payout ratio of 929.43% is unusually high and suggests an unsustainable level of dividend payouts when compared to earnings. In contrast, the FCF-based ratio at 103.03% also exceeds suggested comfort levels, indicating potential pressures in covering dividends with existing cash flows alone.
⚠️ Cashflow & Capital Efficiency
Cash flow assessments offer insights into liquidity, cash generation capacities, and overall capital efficiency, which are critical for sustaining dividend payments and funding growth initiatives.
| Metric | 2025 | 2024 | 2023 |
|---|---|---|---|
| Free Cash Flow Yield | 2.46% | 4.21% | 4.75% |
| Earnings Yield | 0.39% | 5.56% | 6.77% |
| CAPEX to Operating Cash Flow | 0.53 | 0.45 | 0.36 |
| Stock-based Compensation to Revenue | 0.20% | 0.17% | 0.25% |
| Free Cash Flow / Operating Cash Flow Ratio | 0.47 | 0.55 | 0.64 |
| Return on Invested Capital | 9.87% | 9.82% | 12.58% |
GPC shows improving cash flow yields and efficient capital generation. Although CAPEX spending is significant, the operating cash flow coverages and the return on invested capital remain indicators of effective capital deployment.
⚖️ Balance Sheet & Leverage Analysis
A robust balance sheet with prudent leverage levels enhances financial stability, making a company more resilient to economic downturns and capable of sustaining dividend payouts.
| Metric | 2025 | 2024 | 2023 |
|---|---|---|---|
| Debt-to-Equity | 1.87 | 1.32 | 1.11 |
| Debt-to-Assets | 0.40 | 0.30 | 0.27 |
| Debt-to-Capital | 0.65 | 0.57 | 0.53 |
| Net Debt to EBITDA | 10.35 | 3.13 | 1.75 |
| Current Ratio | 1.08 | 1.16 | 1.23 |
| Quick Ratio | 0.46 | 0.51 | 0.63 |
| Financial Leverage | 4.70 | 4.45 | 4.08 |
The improving debt coverage metrics and ratios suggest enhanced financial flexibility, but attention is needed towards reducing leverage to mitigate risks associated with high financial leverage.
📊 Fundamental Strength & Profitability
Examining profitability metrics alongside fundamental strengths like Return on Equity and Asset Management ratios depict operational efficiencies and managerial effectiveness.
| Metric | 2025 | 2024 | 2023 |
|---|---|---|---|
| Return on Equity | 1.49% | 20.84% | 29.91% |
| Return on Assets | 0.32% | 4.69% | 7.33% |
| Net Margin | 0.27% | 3.85% | 5.70% |
| EBIT Margin | 0.89% | 5.42% | 7.82% |
| EBITDA Margin | 3.10% | 7.16% | 9.34% |
| Gross Margin | 34.58% | 36.29% | 35.90% |
With strong returns on equity and assets, GPC demonstrates operational efficiency and robust profitability. These factors are pivotal for sustainable growth.
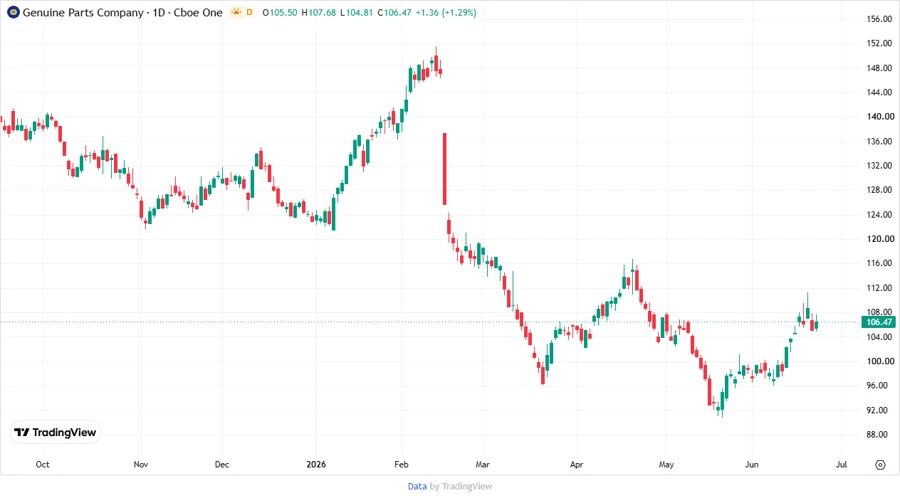
📉 Price Development
⭐ Dividend Scoring System
| Category | Score | Representation |
|---|---|---|
| Dividend Yield | 4 | |
| Dividend Stability | 5 | |
| Dividend Growth | 3 | |
| Payout Ratio | 1 | |
| Financial Stability | 3 | |
| Dividend Continuity | 5 | |
| Cashflow Coverage | 2 | |
| Balance Sheet Quality | 3 |
Total Score: 26/40
🔍 Rating
While Genuine Parts Company has demonstrated a strong dividend history and reasonable growth, current payout metrics suggest caution. Potential investors should weigh the high payout ratios against the company's ability to generate cash flows and consider the implications of its leverage structure. The existing dividend yield and long-standing history provide a stable foundation, but future assessments should focus on financial flexibility and cash generation capacity.
Smart Data Insight
Master the Perfect Entry & Exit for this Stock
Don't leave your profits to chance. Historically, this stock follows specific seasonal patterns that institutional traders use to maximize returns.
- ✅ Identify the "Golden Buying Window"
- ✅ Avoid high-risk correction cycles
- ✅ Backtested data from the last 20+ years