May 19, 2026 a 07:46 am


GPC: Dividend Analysis - Genuine Parts Company
The Genuine Parts Company (GPC) showcases a robust dividend profile with a history of consistent payments over several decades. While the current dividend yield of 4.49% appears attractive, the payout ratios indicate areas of potential concern, especially given the substantial EPS-based payout ratio. Investors should weigh these factors carefully, considering both the historical and projected stability and growth of their investment in GPC.
Overview 📊
This section provides a comprehensive evaluation of Genuine Parts Company's dividend statistics, highlighting key metrics and industry positioning.
| Metric | Value |
|---|---|
| Sector | Unknown |
| Dividend Yield | 4.49% |
| Current Dividend per Share | $4.06 |
| Dividend History | 44 years |
| Last Cut or Suspension | None |
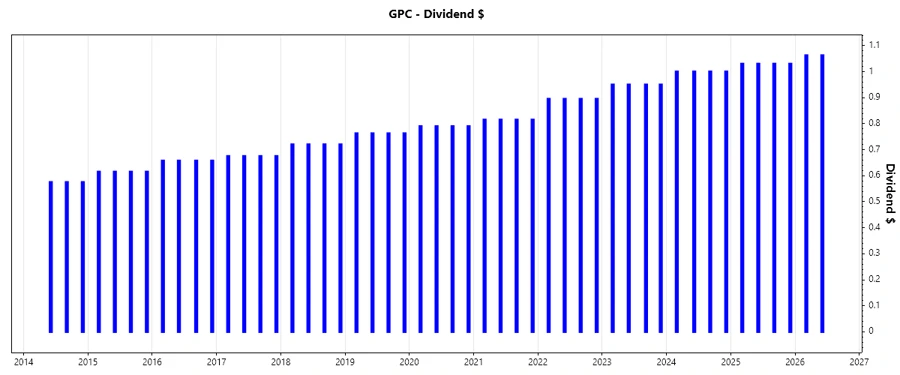
Dividend History 🗣️
Understanding the history of a company's dividends is pivotal in assessing its reliability and long-term commitment to shareholders.
| Year | Dividend per Share (USD) |
|---|---|
| 2026 | 2.125 |
| 2025 | 4.12 |
| 2024 | 4 |
| 2023 | 3.80 |
| 2022 | 3.58 |
Dividend Growth 📈
Analyzing dividend growth over periods can provide insights into the company's future potential and shareholder value enhancement.
| Time | Growth |
|---|---|
| 3 years | 4.79% |
| 5 years | 5.45% |
The average dividend growth is 5.45% over 5 years. This shows moderate but steady dividend growth.
Payout Ratio 📉
The payout ratio is a key indicator of a company's dividend sustainability and its management's confidence in future earnings.
| Key Figure | Ratio |
|---|---|
| EPS-based | 929.43% |
| Free cash flow-based | 103.03% |
The EPS-based payout ratio of 929.43% is alarmingly high, suggesting potential unsustainability. The free cash flow-based ratio of 103.03% also warrants caution, indicating that dividends are being financed through cash flow entirely.
Cashflow & Capital Efficiency ✅
Analysis of cash flow highlights the company's ability to maintain and grow dividends, alongside capital efficiency metrics.
| Metric | 2023 | 2024 | 2025 |
|---|---|---|---|
| Free Cash Flow Yield | 4.75% | 4.21% | 2.46% |
| CAPEX to Operating Cash Flow | 35.71% | 45.34% | 52.75% |
| Stock-based Compensation to Revenue | 0.25% | 0.17% | 0.20% |
| Free Cash Flow / Operating Cash Flow Ratio | 64.29% | 54.65% | 47.25% |
| Return on Invested Capital | 12.58% | 9.82% | 9.87% |
The cash flow metrics reflect adequate stability, though decreasing yield and increasing CAPEX might indicate pressure on free cash flows and future dividend coverage.
Balance Sheet & Leverage Analysis ⚠️
Evaluating balance sheet strength and leverage informs us about the company's financial health and potential risks tied to debt levels.
| Metric | 2023 | 2024 | 2025 |
|---|---|---|---|
| Debt-to-Equity | 1.11 | 1.32 | 1.87 |
| Debt-to-Assets | 27.19% | 29.78% | 39.79% |
| Net Debt to EBITDA | 1.75 | 3.13 | 10.35 |
| Current Ratio | 1.23 | 1.16 | 1.08 |
| Quick Ratio | 0.63 | 0.51 | 0.46 |
The balance sheet shows increasing debt levels over the years, with leverage ratios indicating a possible vulnerability to financial distress.
Fundamental Strength & Profitability 📈
These metrics illuminate Genuine Parts Company's efficiency in deploying assets and equity to generate returns.
| Metric | 2023 | 2024 | 2025 |
|---|---|---|---|
| Return on Equity | 29.91% | 20.84% | 1.49% |
| Return on Assets | 7.33% | 4.69% | 0.32% |
| Net Margin | 5.70% | 3.85% | 0.27% |
| EBITDA Margin | 9.34% | 7.16% | 3.10% |
| Research & Development to Revenue | 0% | 0% | 0% |
Profitability remains a strong point, albeit with some contraction in margins over time which could impact long-term growth prospects.
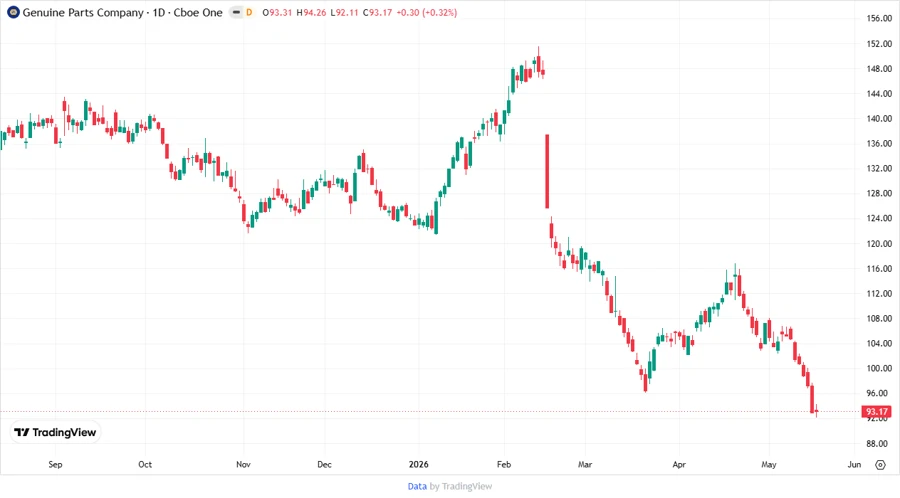
Price Development 📈
Dividend Scoring System 🏆
| Criteria | Rating | Score |
|---|---|---|
| Dividend Yield | 4/5 | |
| Dividend Stability | 5/5 | |
| Dividend Growth | 4/5 | |
| Payout Ratio | 2/5 | |
| Financial Stability | 3/5 | |
| Dividend Continuity | 5/5 | |
| Cashflow Coverage | 3/5 | |
| Balance Sheet Quality | 2/5 |
Total Score: 28/40
Rating ✅
Genuine Parts Company maintains a commendable dividend history, backed by strong continuity and stable payout structures. However, high payout ratios and leverage could impose potential risks moving forward. Investors are advised to balance these factors with the promising yield and stability the company offers. A cautious, yet optimistic approach would best suit potential and current investors in GPC.
Smart Data Insight
Master the Perfect Entry & Exit for this Stock
Don't leave your profits to chance. Historically, this stock follows specific seasonal patterns that institutional traders use to maximize returns.
- ✅ Identify the "Golden Buying Window"
- ✅ Avoid high-risk correction cycles
- ✅ Backtested data from the last 20+ years