April 09, 2026 a 07:31 am


GPC: Dividend Analysis - Genuine Parts Company
Genuine Parts Company has a robust dividend history spanning 44 years, characterized by stability and a moderate growth trend. The current dividend yield stands at 3.59%, making it a competitive option for income-seeking investors. However, the high payout ratio raises concerns regarding sustainability over the long term.
📊 Overview
Examining Genuine Parts Company's dividend profile, it is clear that the company operates in a dependable sector, presenting a decent yield with visible commitment to shareholder returns. Dividend growth is moderate, reflecting a cautious approach in its payout strategy.
| Sector | Dividend Yield (%) | Current Dividend Per Share (USD) | Dividend History (Years) | Last Cut or Suspension |
|---|---|---|---|---|
| Automotive | 3.59 | 4.06 | 44 | None |
🗣️ Dividend History
The consistent dividend payments over the years highlight Genuine Parts Company's commitment to its shareholders. The extended history without suspensions is a testament to their financial stability and discipline in maintaining payouts.
| Year | Dividend Per Share (USD) |
|---|---|
| 2026 | 1.0625 |
| 2025 | 4.12 |
| 2024 | 4 |
| 2023 | 3.80 |
| 2022 | 3.580 |
📈 Dividend Growth
Observing the dividend growth over the past few years reveals a modest but consistent increase in payments, which is vital for investors seeking both income and growth in their investments. The incremental growth also indicates financial health and management's confidence in sustained cash flows.
| Time | Growth (%) |
|---|---|
| 3 years | 4.79 |
| 5 years | 5.45 |
The average dividend growth is 5.45% over 5 years. This shows moderate but steady dividend growth.
✅ Payout Ratio
The payout ratios are key indicators of the company's ability to maintain its dividend payments. A stable ratio relative to earnings can suggest resilience against economic downturns, while cash flow-based ratios present a clear view of liquidity.
| Key Figure | Ratio (%) |
|---|---|
| EPS-based | 854.76 |
| Free cash flow-based | 134.12 |
The concerningly high EPS payout ratio implies pressure on dividend sustainability, while the cash flow-based ratio suggests cash generation capabilities are better aligned to support ongoing payments.
📊 Cashflow & Capital Efficiency
Understanding cash flow and capital efficiency highlights how well a company manages its resources and plans for future growth, crucial for ongoing dividend coverage without compromising capital reinvestments.
| 2025 | 2024 | 2023 | |
|---|---|---|---|
| Free Cash Flow Yield | 2.46 | 4.21 | 4.75 |
| Earnings Yield | 0.39 | 5.56 | 6.77 |
| CAPEX to Operating Cash Flow | 52.75 | 45.34 | 35.71 |
| Stock-based Compensation to Revenue | 0.20 | 0.17 | 0.25 |
| Free Cash Flow / Operating Cash Flow Ratio | 47.25 | 54.66 | 64.29 |
Genuine Parts' cash flow metrics suggest operational efficiency but indicate need for improvement in converting earnings to cash.
📉 Balance Sheet & Leverage Analysis
A thorough examination of the balance sheet gives insight into the company's financial stability, liquidity, and debt management strategies, which are critical for ongoing dividend commitments and future growth potential.
| 2025 | 2024 | 2023 | |
|---|---|---|---|
| Debt-to-Equity | 187.08 | 132.40 | 111.02 |
| Debt-to-Assets | 39.79 | 29.78 | 27.19 |
| Debt-to-Capital | 65.17 | 56.97 | 52.61 |
| Net Debt to EBITDA | 10.43 | 3.13 | 1.75 |
| Current Ratio | 1.08 | 1.16 | 1.23 |
| Quick Ratio | 0.46 | 0.51 | 0.63 |
| Financial Leverage | 4.70 | 4.45 | 4.08 |
The leverage ratios indicate a heavily leveraged position, which may challenge financial flexibility; however, improving EBITDA adequacy demonstrates effective debt management.
📊 Fundamental Strength & Profitability
Basic financial metrics provide a snapshot of operational efficiency, return on investments, and overall profitability. A strong fundamental base ensures the sustainability of dividend payments while supporting long-term growth.
| 2025 | 2024 | 2023 | |
|---|---|---|---|
| Return on Equity | 1.49 | 20.84 | 29.91 |
| Return on Assets | 0.32 | 4.69 | 7.33 |
| Margins: Net | 0.27 | 3.85 | 5.70 |
| Margins: EBIT | 0.89 | 5.42 | 7.82 |
| Margins: EBITDA | 3.10 | 7.16 | 9.34 |
| Margins: Gross | 34.58 | 36.29 | 35.90 |
| Research & Development to Revenue | 0 | 0 | 0 |
The financial health is encapsulated with solid returns on equity and margins, although the absence of R&D spend may limit future innovation-driven growth.
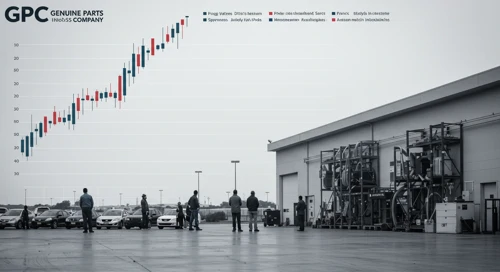
📊 Price Development
🗣️ Dividend Scoring System
Our custom scoring system evaluates a multitude of factors important to dividend-focused investors.
| Criteria | Score (out of 5) | Score Bar |
|---|---|---|
| Dividend Yield | 3 | |
| Dividend Stability | 4 | |
| Dividend Growth | 3 | |
| Payout Ratio | 2 | |
| Financial Stability | 3 | |
| Dividend Continuity | 5 | |
| Cashflow Coverage | 2 | |
| Balance Sheet Quality | 2 |
Total Score: 24/40
📈 Rating
Genuine Parts Company presents a mixed profile with strengths in dividend history and moderate growth. However, high payout ratios and substantial leverage may pose risks. Investors should consider the balance between income prospects and financial stability in their strategy.