April 08, 2026 a 12:47 pm

GPC: Dividend Analysis - Genuine Parts Company
Genuine Parts Company, an established player in the automotive and industrial sector, demonstrates substantial dividend history and stability with a consistent 44-year dividend payout track record. The company offers a respectable dividend yield of 3.59%, alongside moderate growth rates over the past few years. However, there are key areas such as the elevated EPS payout ratio that warrant close examination.
📊 Overview
Genuine Parts Company operates in the diverse sector of automotive and industrial parts. The company's key dividend performance indicators reflect a high level of commitment to shareholders. Nonetheless, the significant EPS-based payout ratio calls for a more nuanced consideration of overall financial health and stability.
| Metrics | Details |
|---|---|
| Sector | Automotive & Industrial |
| Dividend yield | 3.59% |
| Current dividend per share | 4.06 USD |
| Dividend history | 44 years |
| Last cut or suspension | None |
🗣️ Dividend History
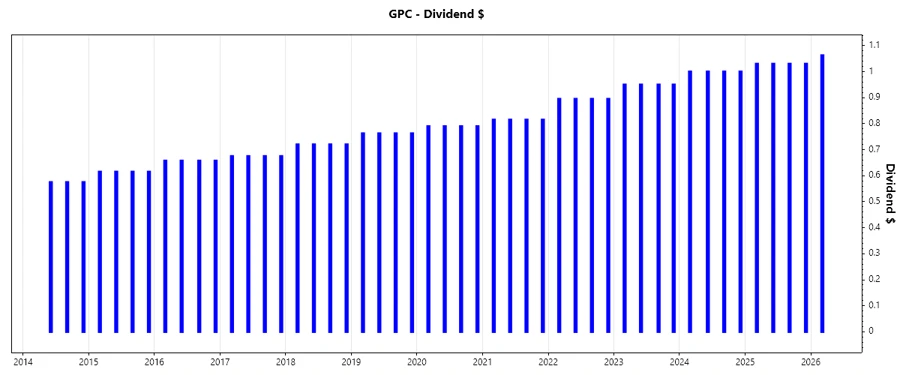
The dividend history of a company speaks volumes about its commitment to rewarding investors, reflecting not just past performance, but potentially forecasting future stability and growth. Genuine Parts Company's long-standing history of 44 consecutive years of payouts underscores a distinct reliability.
| Year | Dividend Per Share (USD) |
|---|---|
| 2026 | 1.0625 |
| 2025 | 4.12 |
| 2024 | 4.00 |
| 2023 | 3.80 |
| 2022 | 3.58 |
📈 Dividend Growth
Dividend growth is a critical indicator of a company's earnings health and management's confidence in its future. Genuine Parts Company's moderate growth rates—4.79% over 3 years and 5.45% over 5 years—point towards a consistent performance trajectory, albeit less aggressive compared to industry leaders.
| Time | Growth |
|---|---|
| 3 years | 4.79% |
| 5 years | 5.45% |
The average dividend growth is 5.45% over 5 years. This shows moderate but steady dividend growth.
📉 Payout Ratio
The payout ratio provides insight into a company's ability to sustain its dividend payments. The current EPS-based payout ratio at 854.76% is notably high, indicating the dividends are not currently fully covered by earnings. Conversely, the free cash flow-based payout ratio of 134.12% suggests dividends are considerably pressuring cash flows, necessitating prudent financial strategies going forward.
| Key Figure | Ratio |
|---|---|
| EPS-based | 854.76% |
| Free cash flow-based | 134.12% |
💰 Cashflow & Capital Efficiency
The analysis of cash flow metrics is pivotal in assessing a company's operational efficiency and its capability to maintain or increase dividend payouts while investing in growth. The high CAPEX to operating cash flow and low free cash flow yields indicate that Genuine Parts Company is heavily reinvesting its capital, which might stress future dividend growth potential unless strategic improvements are made.
| Year | 2023 | 2024 | 2025 |
|---|---|---|---|
| Free Cash Flow Yield | 4.75% | 4.21% | 2.46% |
| Earnings Yield | 6.77% | 5.56% | 3.86% |
| CAPEX to Operating Cash Flow | 35.71% | 45.34% | 52.75% |
| Stock-based Compensation to Revenue | 0.25% | 0.17% | 0.20% |
| Free Cash Flow / Operating Cash Flow Ratio | 64.29% | 54.66% | 47.25% |
These figures suggest that although the company is maintaining operational efficiency, the sustainability of its dividend disbursement could be challenged unless profitability and cash flow improve.
📈 Balance Sheet & Leverage Analysis
Financial stability and leverage ratios are instrumental in understanding a company's long-term viability under various economic conditions. Genuine Parts Company's debt levels relative to its equity and assets are high, reflecting a significant reliance on borrowed funds, which could constrain financial flexibility.
| Year | 2023 | 2024 | 2025 |
|---|---|---|---|
| Debt-to-Equity | 1.11 | 1.32 | 1.87 |
| Debt-to-Assets | 27.19% | 29.78% | 39.79% |
| Debt-to-Capital | 52.61% | 56.97% | 65.17% |
| Net Debt to EBITDA | 1.75 | 3.13 | 10.43 |
| Current Ratio | 1.23 | 1.16 | 1.08 |
| Quick Ratio | 62.98% | 50.88% | 45.90% |
| Financial Leverage | 4.08 | 4.45 | 4.70 |
The company's increased leverage may leave it vulnerable to market fluctuations and interest rate hikes. Adequate measures need to be implemented to manage these risks effectively.
💪 Fundamental Strength & Profitability
Evaluating Genuine Parts Company's fundamental strength and profitability provides a deeper look into its operational efficiency and competitive advantage. The margins, while steady, indicate that there is room for improvement in operational efficiency and cost management.
| Year | 2023 | 2024 | 2025 |
|---|---|---|---|
| Return on Equity | 29.91% | 20.84% | 1.49% |
| Return on Assets | 7.33% | 4.69% | 0.32% |
| Margins - Net | 5.70% | 3.85% | 0.27% |
| Margins - EBIT | 7.82% | 5.42% | 0.89% |
| Margins - EBITDA | 9.34% | 7.16% | 3.10% |
| Margins - Gross | 35.91% | 36.29% | 34.58% |
| R&D to Revenue | 0.0% | 0.0% | 0.0% |
The underlying profitability metrics raise important points about Genuine Parts Company's financial health, particularly the declining return on equity and assets. These are critical for sustaining future growth and should be addressed strategically.
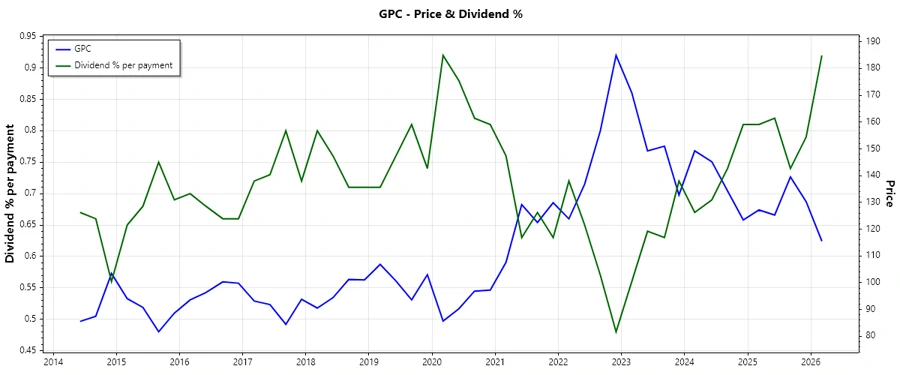
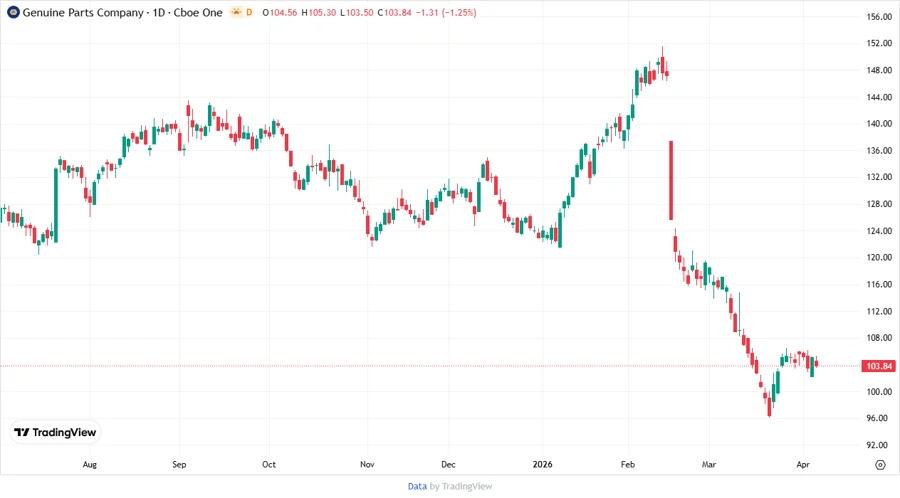
📈 Price Development
📝 Dividend Scoring System
| Criteria | Score | Score Bar |
|---|---|---|
| Dividend yield | 4 | |
| Dividend Stability | 5 | |
| Dividend growth | 3 | |
| Payout ratio | 2 | |
| Financial stability | 3 | |
| Dividend continuity | 5 | |
| Cashflow Coverage | 3 | |
| Balance Sheet Quality | 2 |
Total Score: 27/40
✅ Rating
Genuine Parts Company secures a solid position in its sector, demonstrating dividend reliability but tempered by its high payout and leverage ratios. The overall dividend sustainability appears secure, yet investors are advised to monitor fiscal strategies as the company navigates its fiscal challenges. As such, it holds a cautiously optimistic rating for dividend-seeking investors.
Smart Data Insight
Master the Perfect Entry & Exit for this Stock
Don't leave your profits to chance. Historically, this stock follows specific seasonal patterns that institutional traders use to maximize returns.
- ✅ Identify the "Golden Buying Window"
- ✅ Avoid high-risk correction cycles
- ✅ Backtested data from the last 20+ years