August 09, 2025 a 06:44 am
GOOGL: Fibonacci Analysis - Alphabet Inc.
Alphabet Inc.'s stock has shown significant movement over recent months. With innovative products and a strong market position, GOOGL continues to attract attention from investors. In our detailed analysis, we'll explore key Fibonacci levels to help understand potential price retracements and forecast possible future price moves. This analysis is crucial for traders and analysts monitoring GOOGL's market performance.
Fibonacci Analysis
| Parameter | Details |
|---|---|
| Start Date | 2025-05-09 |
| End Date | 2025-08-08 |
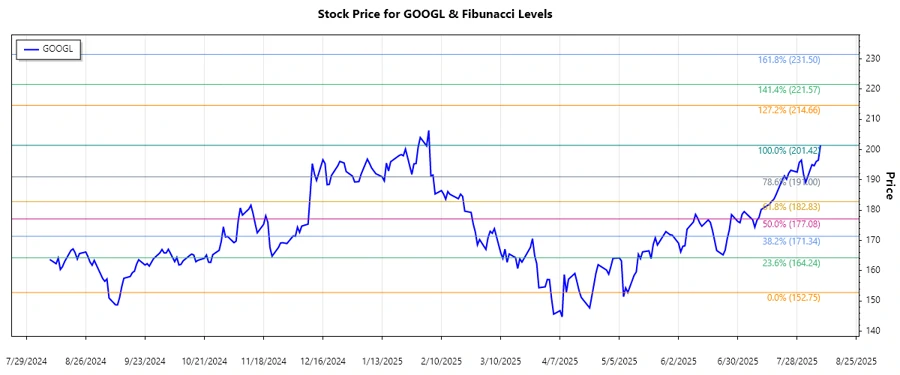
| High Point | 201.42 on 2025-08-08 |
| Low Point | 152.75 on 2025-05-09 |
| Fibonacci Levels |
|
| Current Price | 201.42 |
| Retracement Zone | None - Above 0.786 |
| Technical Interpretation | The current price is beyond the deepest Fibonacci retracement level, indicating strong upward momentum. Investors may see this as a persistent bullish trend, with previous Fibonacci levels potentially acting now as support. |
Conclusion
The analysis of the GOOGL stock reveals a strong upward trend, with prices surpassing even the 0.786 Fibonacci retracement level. This suggests robust bullish sentiment, fueled by Alphabet's solid business foundation and product diversity. However, market volatility and external economic factors still present risks. Analysts should monitor for any signs of reversal or consolidation around current levels. Overall, GOOGL appears to be on a promising trajectory with potential firm support at previously highlighted Fibonacci levels.
Smart Data Insight
Master the Perfect Entry & Exit for this Stock
Don't leave your profits to chance. Historically, this stock follows specific seasonal patterns that institutional traders use to maximize returns.
- ✅ Identify the "Golden Buying Window"
- ✅ Avoid high-risk correction cycles
- ✅ Backtested data from the last 20+ years