August 03, 2025 a 03:15 pm
GOOGL: Fibonacci Analysis - Alphabet Inc.
The stock of Alphabet Inc. (GOOGL) has recently shown a significant uptrend, demonstrating resilience and potential for further gains. Given its diverse product offerings and strong market position, the stock holds strong potential for investors. However, market volatility and competitive pressures remain key factors that could influence future performance.
Fibonacci Analysis
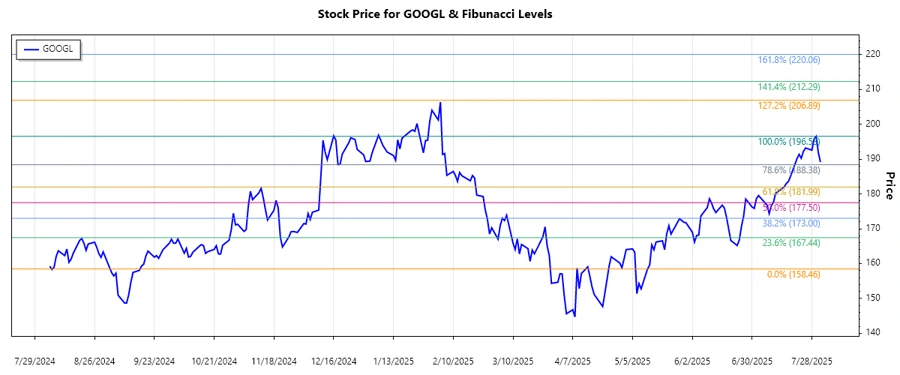
The recent trend has been identified as an upward movement starting in April 2025, with a dominant bullish sentiment. Based on this trend, we perform a Fibonacci Retracement analysis to identify potential support and resistance levels.
| Detail | Value |
|---|---|
| Trend Start Date | 2025-05-08 |
| Trend End Date | 2025-07-30 |
| High Point | $196.53 on 2025-07-30 |
| Low Point | $158.46 on 2025-05-12 |
Fibonacci Retracement Levels
| Level | Price |
|---|---|
| 0.236 | $187.63 |
| 0.382 | $184.06 |
| 0.5 | $177.50 |
| 0.618 | $171.12 |
| 0.786 | $162.92 |
The current stock price of $189.13 is in the retracement zone closest to the 0.236 level ($187.63), indicating a potential support level. If the price fails to hold this level, it may retest lower Fibonacci levels. Otherwise, a rebound could signal a continuation of the uptrend.
Conclusion
The upward trend in Alphabet's stock highlights investor confidence in the company's robust product lineup and market adaptability. However, potential corrections signaled by Fibonacci retracement levels could offer strategic entry points for investors looking to capitalize on the stock's potential instead of simply riding the current uptrend. The technical analysis suggests that while the market may test lower support levels, strength in fundamentals may favor a continued upward trajectory. Investors are encouraged to monitor retracement levels to identify optimal buying opportunities, while considering external economic factors that may influence stock performance.
Smart Data Insight
Master the Perfect Entry & Exit for this Stock
Don't leave your profits to chance. Historically, this stock follows specific seasonal patterns that institutional traders use to maximize returns.
- ✅ Identify the "Golden Buying Window"
- ✅ Avoid high-risk correction cycles
- ✅ Backtested data from the last 20+ years