October 05, 2025 a 02:03 pm

GNRC: Trend and Support & Resistance Analysis - Generac Holdings Inc.
Generac Holdings Inc. is known for its innovative power generation equipment and related products, featuring prominently in both residential and industrial sectors. The stock has experienced fluctuations but remains strong within its field. Technical analysis suggests certain key trends and zones for investors to watch in the coming weeks.
Trend Analysis
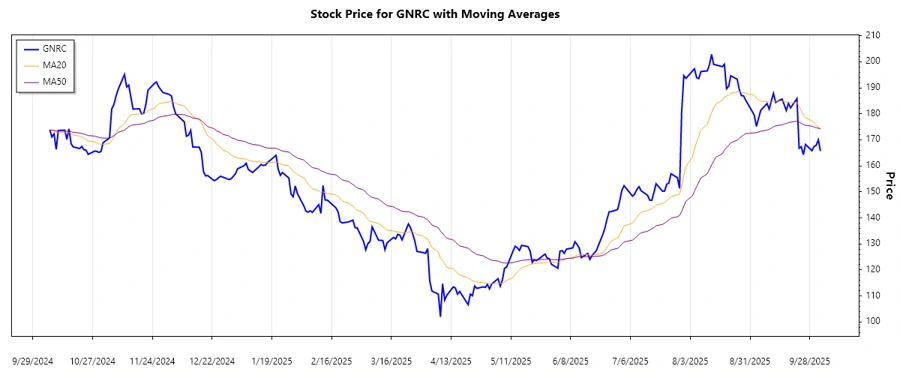
The technical analysis of Generac Holdings Inc. (GNRC) indicates a consistent trend in recent market behavior. By calculating the Exponential Moving Averages (EMA) for both 20 and 50 days from the closing prices, a clear picture of the trend has emerged:
| Date | Closing Price | Trend |
|---|---|---|
| 03-Oct-2025 | $165.67 | ▼ |
| 02-Oct-2025 | $169.99 | ▼ |
| 01-Oct-2025 | $167.89 | ▼ |
| 30-Sep-2025 | $167.40 | ▼ |
| 29-Sep-2025 | $165.82 | ▼ |
| 26-Sep-2025 | $168.27 | ▲ |
| 25-Sep-2025 | $164.26 | ▼ |
Currently, EMA20 is below EMA50, indicating a ▼ Abwärtstrend. This could suggest a bearish sentiment in the market.
Support- and Resistance
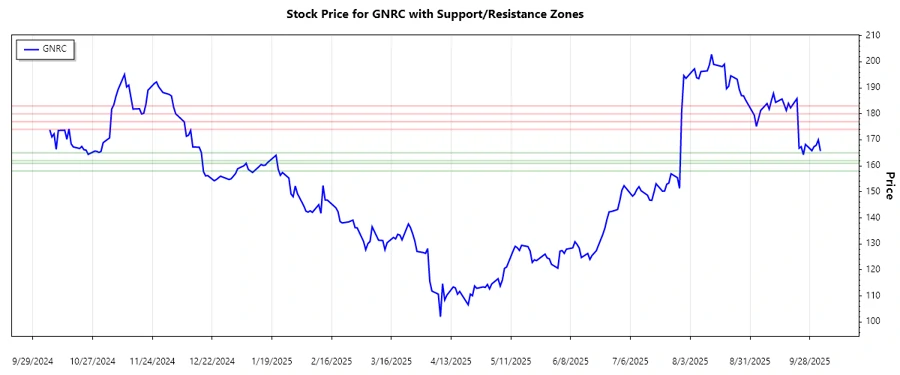
The important support and resistance zones have been calculated from closing prices to identify price levels where significant buying or selling could occur:
| Zone Type | Price Range | Direction |
|---|---|---|
| Support 1 | $162 - $165 | ▼ |
| Support 2 | $158 - $161 | ▼ |
| Resistance 1 | $174 - $177 | ▲ |
| Resistance 2 | $180 - $183 | ▲ |
The current price is near the lower support zone, which could indicate a potential buying opportunity if the price holds.
Conclusion
Generac Holdings Inc. (GNRC) shows a ▼ bearish trend according to the EMA indicators and current price position near key support levels. While this might suggest a cautionary tone for short-term traders, the proximity to the support zones implies potential entry points for longer-term investors. It's essential to monitor these levels closely for any breakout or reversal that might signal a change in market sentiment.
Smart Data Insight
Master the Perfect Entry & Exit for this Stock
Don't leave your profits to chance. Historically, this stock follows specific seasonal patterns that institutional traders use to maximize returns.
- ✅ Identify the "Golden Buying Window"
- ✅ Avoid high-risk correction cycles
- ✅ Backtested data from the last 20+ years