September 06, 2025 a 09:03 am


GNRC: Trend and Support & Resistance Analysis - Generac Holdings Inc.
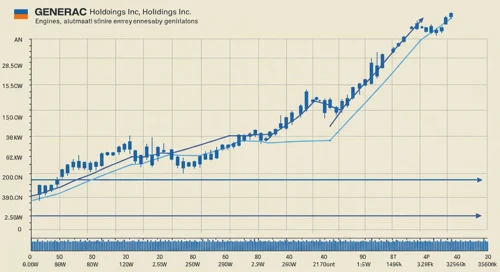
Generac Holdings Inc. displays significant movements in the stock market, recently showing a shifting trend that technical analysts are closely monitoring. Over the past months, GNRC has demonstrated both resilience and volatility, typical for a company within the power generation sector. Understanding these trends and identifying potential support and resistance levels is crucial for making informed investment decisions.
Trend Analysis
After analyzing the closing prices, the Exponential Moving Averages (EMA) provide insights into the current trend of GNRC. The EMA20 has recently crossed below the EMA50, signaling a ▼ downward trend.
| Date | Close | Trend |
|---|---|---|
| 2025-09-05 | $181.3 | ▼ |
| 2025-09-04 | $178.18 | ▼ |
| 2025-09-03 | $175.14 | ▼ |
| 2025-09-02 | $179.51 | ▲ |
| 2025-08-29 | $185.25 | ▲ |
| 2025-08-28 | $186.92 | ▲ |
| 2025-08-27 | $186.99 | ▲ |
The current downward trend suggests caution for those considering entering at this level. Investors should weigh additional factors before making further evaluations.
Support and Resistance
Analyzing the historical price data, we identify key support and resistance zones that could influence future price movements.
| Zone | From | To |
|---|---|---|
| Support | $150.00 | $155.00 |
| Support | $140.00 | $145.00 |
| Resistance | $185.00 | $190.00 |
| Resistance | $180.00 | $185.00 |
Currently, the price resides between the two resistance zones, indicating potential for continued downward movement unless broken.
Conclusion
Generac Holdings Inc.'s market position requires investors to consider the volatile movements in recent months. The identified downward trend calls for cautious optimism, while key support and resistance levels highlight potential areas where price reversals might occur. Investors should continue to monitor market conditions and evaluate ongoing developments for informed decision-making.
json In this analysis, we observed a technical downtrend, with GNRC's closing prices suggesting diminished momentum. The presence of active support and resistance levels indicates potential price pivots. Investors must exercise diligence, given the stock's recent patterns and the overall market context.
Smart Data Insight
Master the Perfect Entry & Exit for this Stock
Don't leave your profits to chance. Historically, this stock follows specific seasonal patterns that institutional traders use to maximize returns.
- ✅ Identify the "Golden Buying Window"
- ✅ Avoid high-risk correction cycles
- ✅ Backtested data from the last 20+ years