September 03, 2025 a 01:16 pm


GNRC: Trend and Support & Resistance Analysis - Generac Holdings Inc.
Generac Holdings Inc., a leading power generation equipment manufacturer, has shown fluctuating stock trends. Recent data reveals varied movement, influenced by market dynamics and strategic business operations. Careful evaluation of trends, support, and resistance levels is crucial for understanding potential investment opportunities.
Trend Analysis
| Date | Closing Price | Trend |
|---|---|---|
| 2025-09-02 | $179.51 | ⚖️ |
| 2025-08-29 | $185.25 | ▲ |
| 2025-08-28 | $186.92 | ▲ |
| 2025-08-27 | $186.99 | ▲ |
| 2025-08-26 | $189.32 | ▲ |
| 2025-08-25 | $193.28 | ▲ |
| 2025-08-22 | $194.64 | ▲ |
The recent EMA calculations indicate an uptrend, with the EMA20 consistently above the EMA50 in the freshest data points. This alignment suggests upward momentum within the analyzed period that might imply potential growth or investment opportunities.
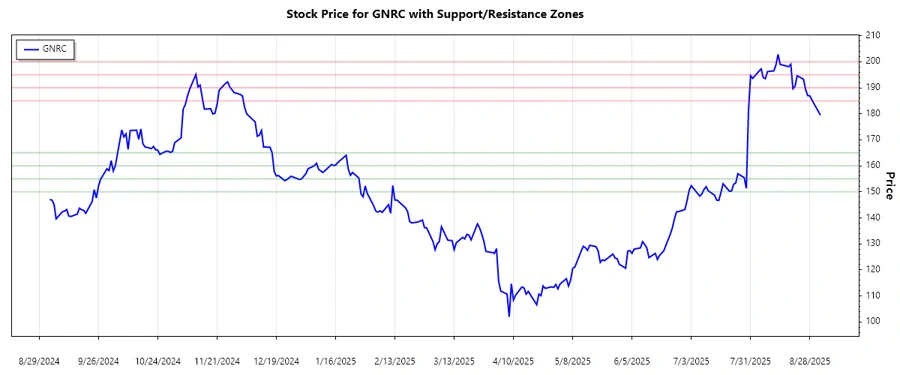
Support- and Resistance
| Zone | Range | Status |
|---|---|---|
| Support 1 | $150 - $155 | ▲ |
| Support 2 | $160 - $165 | ▲ |
| Resistance 1 | $185 - $190 | ▼ |
| Resistance 2 | $195 - $200 | ▼ |
The current stock price is approaching the first resistance level, where it might encounter selling pressure. If the price breaks through, it could test higher resistance zones, otherwise, it might stabilize or pull back towards support levels.
Conclusion
Generac Holdings Inc.'s stock is currently exhibiting an uptrend as observed through EMA alignment, suggesting bullish momentum. The proximity of the current price to resistance levels demands caution, indicating potential volatility. Investors could benefit from awaiting confirmation of trend continuation past the resistance or watch for retracements to support. Strategic planning is essential when operating within such dynamic price ranges which reflect the underlying business's fluctuating market conditions.