
July 10, 2026 a 08:15 am
GL: Trend and Support & Resistance Analysis - Globe Life Inc.
Over recent months, Globe Life Inc. has demonstrated an overall upward trend. The stock exhibits resilience, supported primarily by its target market in the lower-middle to middle-income brackets across the United States. With diverse offerings spanning life insurance, supplementary health coverage, and annuities, Globe Life remains a key player in securing financial protection for its clientele.
Trend Analysis
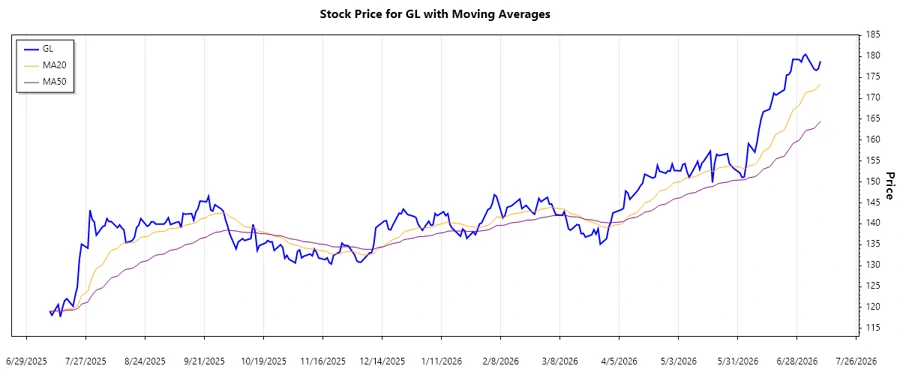
The trend analysis is based on the calculated EMA20 and EMA50 values, derived from historical closing prices. The crossing of these two EMAs indicates dominant trends.
| Date | Close | Trend |
|---|---|---|
| 2026-07-09 | 178.86 | ▲ Up |
| 2026-07-08 | 177.07 | ▲ Up |
| 2026-07-07 | 176.67 | ▲ Up |
| 2026-07-06 | 176.98 | ▲ Up |
| 2026-07-02 | 180.49 | ▲ Up |
| 2026-07-01 | 180.07 | ▲ Up |
| 2026-06-30 | 178.68 | ▲ Up |
As evidenced by the consistently higher EMA20 over EMA50, the stock is in a strong uptrend indicating bullish momentum.
Support- and Resistance
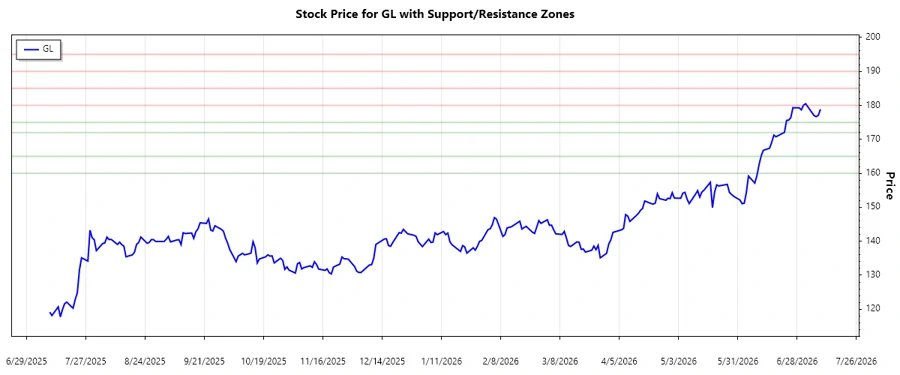
Identified support and resistance zones are key to understanding potential future price movements and the strength of the current trend.
| Zone | From | To |
|---|---|---|
| Support Zone 1 | ▲ 172.00 | ▲ 175.00 |
| Support Zone 2 | ▲ 160.00 | ▲ 165.00 |
| Resistance Zone 1 | ▼ 180.00 | ▼ 185.00 |
| Resistance Zone 2 | ▼ 190.00 | ▼ 195.00 |
Currently, the stock is hovering near the lower bound of its primary resistance zone, hinting at a potential pullback if not breached.
Conclusion
Globe Life Inc.'s robust operational framework and strategic market position make it a compelling choice for investors. The prevailing uptrend signifies strong performance, yet caution is advised approaching identified resistance levels. Despite potential pullback risks, the company's diversified portfolio across essential insurance offerings buttresses its fundamental stability. Market participants should watch for continued strength in key business segments to better ascertain long-term viability.
Smart Data Insight
Master the Perfect Entry & Exit for this Stock
Don't leave your profits to chance. Historically, this stock follows specific seasonal patterns that institutional traders use to maximize returns.
- ✅ Identify the "Golden Buying Window"
- ✅ Avoid high-risk correction cycles
- ✅ Backtested data from the last 20+ years