May 15, 2026 a 01:15 pm
GL: Trend and Support & Resistance Analysis - Globe Life Inc.
Globe Life Inc. (GL) is currently under close observation as its price action indicates pivotal levels for short to mid-term movements. The company, a key player in offering life and supplemental insurance, has seen its stock price fluctuate over recent months, showing signs that align with broader market conditions. Investors should be cognizant of the emerging trends and key price zones that may dictate future performance. The analysis below dissects the recent technical dynamics through moving averages and support/resistance zones critical to forthcoming price behavior.
Trend Analysis
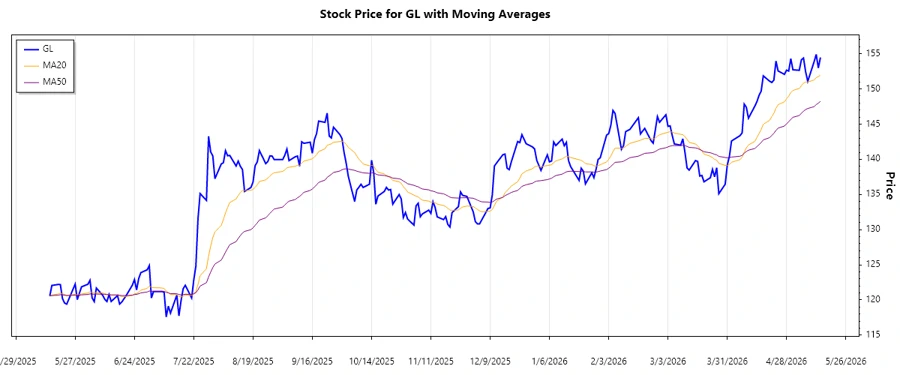
A comprehensive analysis of Globe Life Inc.'s stock price reveals insights into its prevailing trend. Utilizing an Exponential Moving Average (EMA), with periods set at 20 and 50 days, we observe critical tendencies. An observed cross of EMA20 over EMA50 would historically signify a bullish trend, while the reverse suggests bearishness. Should the two EMAs converge, a horizontal or sideways trend is implied.
| Date | Closing Price | Trend |
|---|---|---|
| 2026-05-14 | 154.47 | ▲ Bullish |
| 2026-05-13 | 152.99 | ▲ Bullish |
| 2026-05-12 | 154.91 | ▲ Bullish |
| 2026-05-11 | 153.86 | ▲ Bullish |
| 2026-05-08 | 151.08 | ▲ Bullish |
| 2026-05-07 | 152.45 | ▲ Bullish |
| 2026-05-06 | 154.39 | ▲ Bullish |
The observable data confirms a persistent bullish trend, with the EMA20 consistently outperforming the EMA50. This upward momentum suggests continued investor confidence.
Support and Resistance
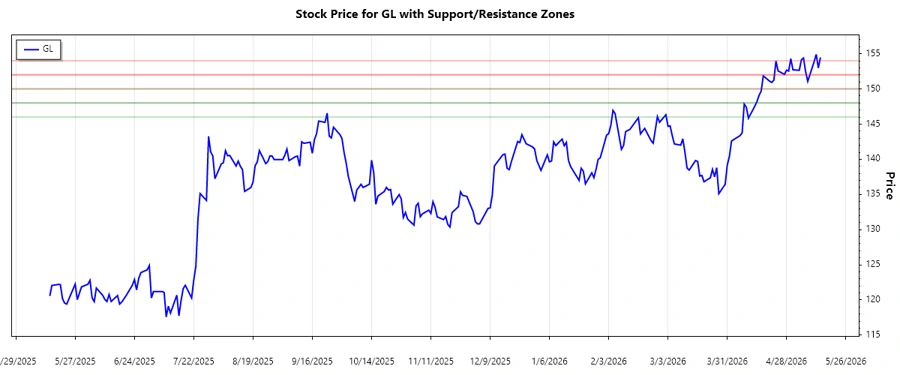
Significant support and resistance levels can provide a roadmap to potential price floors and ceilings. Identifying such zones entails analyzing previous highs and lows in the stock’s history, offering critical junctures for potential reversals.
| Zone | Price Range |
|---|---|
| Resistance 1 | ▲ 152.00 - 154.00 |
| Resistance 2 | ▲ 150.00 - 152.00 |
| Support 1 | ▼ 148.00 - 150.00 |
| Support 2 | ▼ 146.00 - 148.00 |
The latest price remains entrenched within a critical resistance zone, suggesting that breaking through it could propel further gains or face a reversal due to selling pressure.
Conclusion
In conclusion, Globe Life Inc. exhibits a dominant upward trend supported by favorable technical indicators. The juxtaposition of higher moving averages aligns with recent price action, establishing a positive outlook for investors. However, sustained trends rely heavily on breaking through resistance barriers while negotiating substantial support levels. Prevailing market conditions and strategic decisions remain pivotal in charting future price movements, emphasizing the importance of ongoing observation as trends evolve.
Smart Data Insight
Master the Perfect Entry & Exit for this Stock
Don't leave your profits to chance. Historically, this stock follows specific seasonal patterns that institutional traders use to maximize returns.
- ✅ Identify the "Golden Buying Window"
- ✅ Avoid high-risk correction cycles
- ✅ Backtested data from the last 20+ years