November 28, 2025 a 04:03 am

GL: Trend and Support & Resistance Analysis - Globe Life Inc.
Globe Life Inc. displays a mixed market environment, characterized by numerous fluctuations in recent months. The technical indicators derived from historical data suggest a generally stable pattern with evident trading levels. Investors should remain cautious while considering significant resistance levels seen in the past months.
Trend Analysis
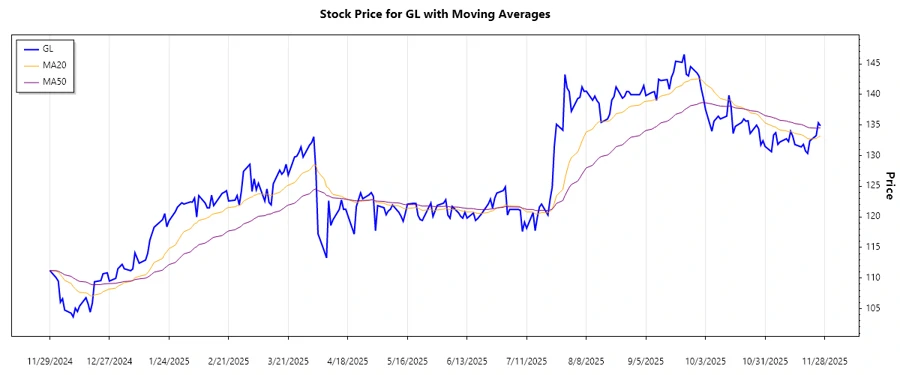
The examination of Globe Life Inc.'s data over the last weeks reveals a subtle downward tendency with varying momentum. Upon calculating the Exponential Moving Averages (EMA20 and EMA50), there is an indication of a ▼ downward trend, as EMA20 (133.79) is below EMA50 (134.65).
| Date | Close Price | Trend |
|---|---|---|
| 2025-11-26 | $134.87 | ▼ |
| 2025-11-25 | $135.37 | ▲ |
| 2025-11-24 | $133.27 | ▼ |
| 2025-11-21 | $132.42 | ▼ |
| 2025-11-20 | $130.37 | ▼ |
| 2025-11-19 | $130.74 | ▲ |
| 2025-11-18 | $131.85 | ▲ |
The downward trend implies overall market hesitance, potentially influenced by external economic factors or internal business adjustments.
Support- and Resistance
Analyzing the support and resistance levels in recent market data, two critical support zones identified are between $130.00 and $132.00, and between $125.00 and $127.00. Similarly, the resistance zones are placed between $135.00 and $137.00, and between $139.00 and $141.00.
| Zone Type | From | To |
|---|---|---|
| Support Zone 1 | 130.00 ▲ | 132.00 |
| Support Zone 2 | 125.00 | 127.00 |
| Resistance Zone 1 | 135.00 ▼ | 137.00 |
| Resistance Zone 2 | 139.00 ▼ | 141.00 |
The current price of $134.87 is near the upper border of the support zone 1, suggesting a possible bounce if the zone maintains its strength and enough buying interest appears.
This scenario is subject to testing market resilience and potential breaches if momentum fails to support holding these levels.
Conclusion
Globe Life Inc.'s recent price movements illustrate potential market uncertainties, with important support and resistance levels marking decisive points. A downward trend indicated by moving averages suggests cautious optimism as resistance levels near. The current trajectory presents an opportunity for buyers at lower support levels, while resistance provides sell-off options. Market dynamics, fueled by external factors and company performance, will dictate future trends. Analysts should maintain a close watch on these technical levels to make informed decisions. Monitoring external conditions and corporate maneuvers is vital to navigate this environment effectively.