November 02, 2025 a 04:03 am


GL: Trend and Support & Resistance Analysis - Globe Life Inc.
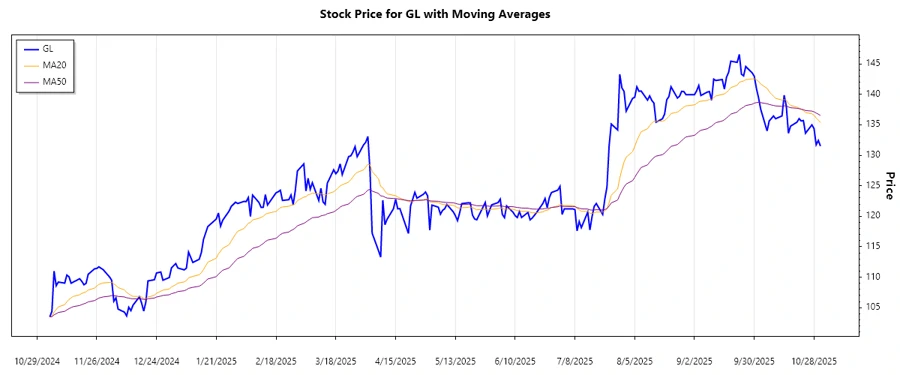
Globe Life Inc. has shown fluctuating patterns over the past few months, reflecting the broader market's volatility. The company operates primarily in the insurance sector, targeting middle-income households in the United States. Recent data indicates a cautious optimism, but the stock remains subject to economic changes and policy shifts affecting insurance industries.
Trend Analysis
| Date | Closing Price | Trend |
|---|---|---|
| 2025-10-31 | 131.51 | ▲ |
| 2025-10-30 | 132.44 | ▲ |
| 2025-10-29 | 131.73 | ▼ |
| 2025-10-28 | 134.37 | ▲ |
| 2025-10-27 | 134.99 | ▲ |
| 2025-10-24 | 133.62 | ▼ |
| 2025-10-23 | 135.7 | ▲ |
The EMA calculations suggest that the trend is currently in an upward trajectory, as indicated by the short-term EMA20 being above the long-term EMA50. This suggests positive momentum, but market participants should remain vigilant for potential shifts.
Support- and Resistance
| Zone Type | From ($) | To ($) |
|---|---|---|
| Support Zone 1 | 122.00 | 124.00 |
| Support Zone 2 | 110.00 | 112.00 |
| Resistance Zone 1 | 136.00 | 138.00 |
| Resistance Zone 2 | 140.00 | 142.00 |
The current closing price is hovering around 131.51, sitting between the designated support and resistance zones. Traders may consider it a consolidation area, awaiting breakout signals.
Conclusion
Globe Life Inc. stock presents potential growth opportunities given its current position slightly below major resistance levels. The upward EMA trend indicates sustained positive momentum, although the insurance sector could face headwinds from regulatory changes and economic adjustments. It's vital for analysts to monitor fiscal policies impacting the middle-income demographic that Globe Life serves.
Smart Data Insight
Master the Perfect Entry & Exit for this Stock
Don't leave your profits to chance. Historically, this stock follows specific seasonal patterns that institutional traders use to maximize returns.
- ✅ Identify the "Golden Buying Window"
- ✅ Avoid high-risk correction cycles
- ✅ Backtested data from the last 20+ years