June 30, 2025 a 03:15 am


GL: Trend and Support & Resistance Analysis - Globe Life Inc.
Globe Life Inc. has shown resilience in its share price over recent months with fluctuations between significant price levels. Its main business of providing life and supplemental health insurance to middle-income households positions it well in the financial services market. Tracking recent pricing movements and analyzing key indicators can provide insights into potential future performance especially for investors focusing on long-term value.
Trend Analysis
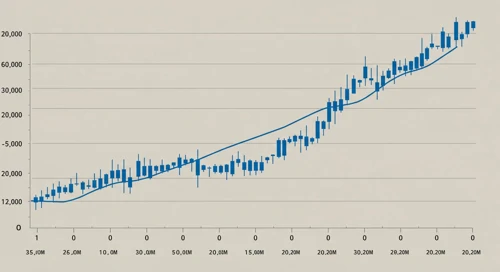
Analyzing recent data for Globe Life Inc., an upward trend is evident as the EMA20 remains above the EMA50. This trend suggests sustained buying interest, further supported by consistent support at lower price levels. Here is the analysis for the last seven trading days, outlining the closing prices and interpreted trend direction:
| Date | Close | Trend |
|---|---|---|
| 2025-06-27 | 123.89 | ▲ Uptrend |
| 2025-06-26 | 123.04 | ▲ Uptrend |
| 2025-06-25 | 121.42 | ⚖️ Side |
| 2025-06-24 | 122.91 | ▲ Uptrend |
| 2025-06-23 | 122.11 | ▼ Downtrend |
| 2025-06-20 | 120.59 | ▼ Downtrend |
| 2025-06-18 | 119.71 | ▼ Downtrend |
Overall, the stock demonstrates an ascending trajectory, indicating potential bullish momentum.
Support and Resistance
By examining historical data, we identify the following key support and resistance zones:
| Zone Type | From | To |
|---|---|---|
| Support Zone 1 | 118.00 | 120.00 |
| Support Zone 2 | 112.00 | 114.00 |
| Resistance Zone 1 | 125.00 | 127.00 |
| Resistance Zone 2 | 130.00 | 132.00 |
Currently, the price hovers near the upper ranges of its resistance level. This might suggest selling pressure might develop if unable to break through current highs.
Conclusion
Globe Life Inc. showcases potential for upward gains with a robust positioning in its market niche. Key support and resistance levels provide identifiable entry and exit points for traders. However, price consolidation near resistance levels needs monitoring to avoid potential reversal risks. The analysis suggests a balanced view where maintaining current positions is reasonable, but caution around resistance limits is advised.