June 03, 2026 a 05:15 am
GL: Fibonacci Analysis - Globe Life Inc.
Globe Life Inc. has shown remarkable resilience in its market standing. Known for providing comprehensive insurance solutions, the stock has seen varying trends in recent months. The recent uptrend solidifies Globe Life's position, reflecting investor confidence in its strategic growth initiatives. Given its performance, analyzing the Fibonacci retracement levels could provide valuable insight for upcoming market movements.
Fibonacci Analysis
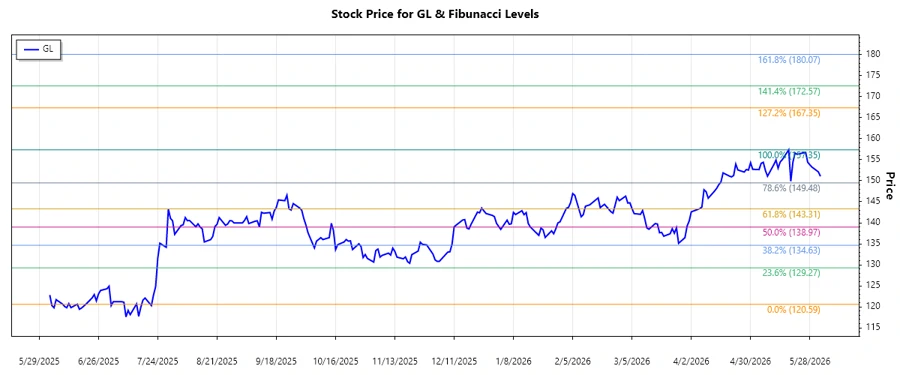
The recent trend of Globe Life Inc. (Ticker: GL) has been a notable uptrend. Analyzing the data, the high occurred on May 18, 2026, with a price of $157.35, while the low was recorded on January 23, 2026, at $120.59.
| Aspect | Details |
|---|---|
| Start Date | January 23, 2026 |
| End Date | May 18, 2026 |
| High Point | $157.35 (May 18, 2026) |
| Low Point | $120.59 (January 23, 2026) |
Fibonacci Retracement Levels:
| Level | Price |
|---|---|
| 0.236 | $130.04 |
| 0.382 | $135.56 |
| 0.500 | $138.97 |
| 0.618 | $142.39 |
| 0.786 | $147.04 |
The current price of $151.05, as of June 2, 2026, is between the 0.786 and the high point, indicating a move out of a retracement zone and suggesting potential support near $147.04.
In a technical perspective, as the current price surpasses the 0.786 retracement level, it demonstrates bullish momentum with a likely target towards the recent high.
Conclusion
The upward trend in Globe Life Inc.'s stock instills confidence in its ability to perform amidst market fluctuations. While the 0.786 Fibonacci level may act as a support level, further upward movement could be anticipated given the stock's recent momentum. However, analysts should remain cautious of potential volatility, particularly if the price revisits key retracement levels. In summary, Globe Life Inc. holds potential for growth, but investors should be vigilant in watching for shifts at critical price levels.
Smart Data Insight
Master the Perfect Entry & Exit for this Stock
Don't leave your profits to chance. Historically, this stock follows specific seasonal patterns that institutional traders use to maximize returns.
- ✅ Identify the "Golden Buying Window"
- ✅ Avoid high-risk correction cycles
- ✅ Backtested data from the last 20+ years