March 25, 2026 a 05:15 am
GL: Fibonacci Analysis - Globe Life Inc.
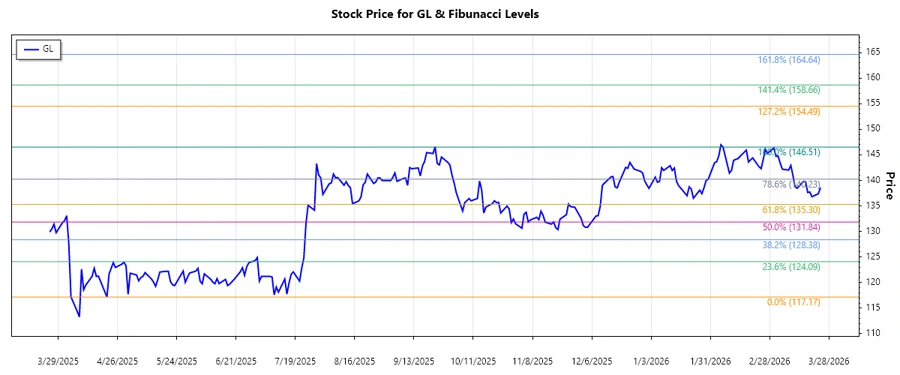
Globe Life Inc., a renowned player in the insurance sector with a focus on middle-income households, has shown varied financial performances over the past few months. With its broad range of life and supplemental health insurance products, the company remains influential in its sector. The recent data indicates certain technical trends that may offer potential trading opportunities, especially when analyzed using Fibonacci retracement levels. Investors should be keenly aware of the identified support and resistance levels.
Fibonacci Analysis
| Parameter | Details |
|---|---|
| Trend Period | 2025-07-15 to 2026-03-24 |
| High Point | $146.51 on 2026-02-06 |
| Low Point | $117.17 on 2025-04-21 |
| Fibonacci Levels |
|
| Current Level | Currently in the 0.618 Retracement Zone ($135.41) |
The current price level is suggesting a potential short-term resistance around the 0.618 retracement zone. This can often indicate a point where the market might consolidate or reverse, providing key insights for traders seeking to enter or exit positions.
Conclusion
The Fibonacci analysis of Globe Life Inc. indicates the current pricing in the 0.618 retracement zone, suggesting potential for market consolidation or reversal. The broader trend reflects a bullish sentiment, but investors should remain cautious of potential resistance at this level. Technical interpretation implies that if the price breaks through this level, it could continue upward towards the previous highs. However, failure to hold could indicate a shift towards bearish sentiment. Analysts should keep an eye on price movements relative to these key technical levels for guidance on future opportunities and risks.