
June 21, 2026 a 02:46 am

📊 GL: Dividend Analysis - Globe Life Inc.
Globe Life Inc. is a strong contender in the insurance sector, known for its disciplined financial strategies and stable dividend payouts. With a remarkable history of 41 consecutive years of dividend distributions, the company stands out as a reliable choice for steady income. However, investors must weigh the relatively low dividend yield against its consistency and growth potential.
🗣️ Overview
Globe Life Inc., a steady player in the financial services sector, offers a glimpse into its dividend policy through key metrics. Despite a modest dividend yield of 0.70%, the historical consistency of 41 years without interruption enhances its appeal for income-focused investors.
| Key Metric | Value |
|---|---|
| Sector | Insurance |
| Dividend yield | 0.70% |
| Current dividend per share | 1.06 USD |
| Dividend history | 41 years |
| Last cut or suspension | None |
📈 Dividend History
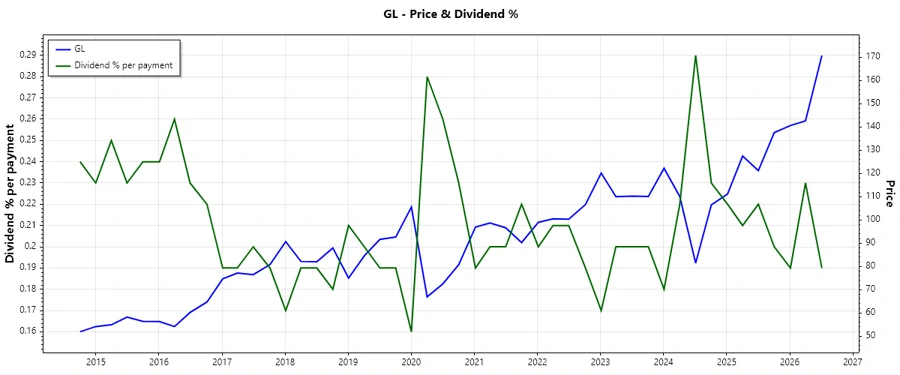
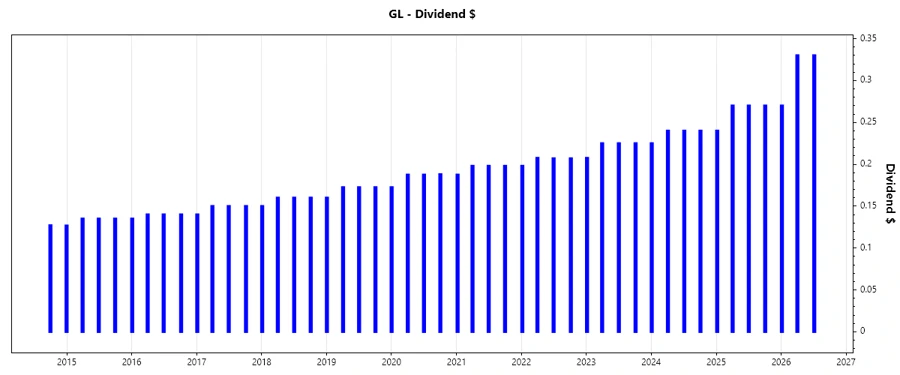
An integral part of Globe Life's value proposition is its robust dividend history. Consistent payouts across decades reinforce investors' confidence, even in volatile markets. Such reliable payment records can significantly enhance long-term investment returns through compounding effects.
| Year | Dividend per Share (USD) |
|---|---|
| 2026 | 0.93 |
| 2025 | 1.05 |
| 2024 | 0.945 |
| 2023 | 0.8825 |
| 2022 | 0.8195 |
📈 Dividend Growth
The growth of dividends over time is crucial for income resilience against inflation. A growth rate of 8.61% over three years and 7.38% over five years reflects Globe Life's commitment to enhancing shareholder value. An average growth of 7.38% over the last five years signifies moderate but steady dividend growth.
| Time | Growth |
|---|---|
| 3 years | 8.61% |
| 5 years | 7.38% |
The average dividend growth is 7.38% over 5 years. This shows moderate but steady dividend growth.
📉 Payout Ratio
The payout ratio is a critical measure for assessing a company's ability to sustain its dividend payments. A low EPS-based payout ratio of 7.09% coupled with a free cash flow-based ratio of 6.72% indicates a substantial buffer in Globe Life's earnings to cover dividends, underscoring strong dividend sustainability.
| Key Figure | Ratio |
|---|---|
| EPS-based | 7.09% |
| Free cash flow-based | 6.72% |
These figures highlight Globe Life’s robust capacity to maintain dividends while retaining the potential for reinvestment and growth.
💰 Cashflow & Capital Efficiency
Examining the cash flow and capital efficiency of Globe Life reveals insights into its operational robustness. The free cash flow yield and earnings yield suggest efficient cash management, while the allocation of CAPEX to operating cash flow demonstrates prudent capital allocation.
| Metric | 2025 | 2024 | 2023 |
|---|---|---|---|
| Free Cash Flow Yield | 11.09% | 14.22% | 12.38% |
| Earnings Yield | 10.27% | 11.44% | 8.39% |
| CAPEX to Operating Cash Flow | 10.20% | 5.07% | 3.34% |
| Stock-based Compensation to Revenue | 0% | 0% | 0% |
| Free Cash Flow / Operating Cash Flow Ratio | 89.80% | 94.93% | 96.66% |
These metrics suggest a well-functioning cash conversion cycle and high capital efficiency, supporting further growth initiatives.
🔍 Balance Sheet & Leverage Analysis
A thorough analysis of Globe Life’s balance sheet showcases its financial leverage and risk profile. Key ratios reveal a prudent approach to leverage, providing assurances of its liabilities management relative to equity and assets.
| Metric | 2025 | 2024 | 2023 |
|---|---|---|---|
| Debt-to-Equity | 0.44 | 0.52 | 0.47 |
| Debt-to-Assets | 8.52% | 9.42% | 7.54% |
| Debt-to-Capital | 30.53% | 34.05% | 32.04% |
| Net Debt to EBITDA | 1.56 | 1.77 | 1.55 |
| Current Ratio | 9.66 | 9.48 | 10.83 |
| Quick Ratio | 9.66 | 9.48 | 10.83 |
| Financial Leverage | 5.16 | 5.48 | 6.25 |
Globe Life exhibits a balanced leverage profile, with low levels of debt indicating sound financial discipline and reduced insolvency risks.
🚀 Fundamental Strength & Profitability
Understanding the comprehensive profitability of Globe Life is central to its investment case. The company’s robust ROE and ROA indices, alongside solid profit margins, underscore its profitability within its operative framework.
| Metric | 2025 | 2024 | 2023 |
|---|---|---|---|
| Return on Equity | 19.43% | 20.18% | 21.64% |
| Return on Assets | 3.77% | 3.68% | 3.46% |
| Margins: Net | 19.36% | 18.53% | 17.82% |
| Margins: EBIT | 26.54% | 25.16% | 23.80% |
| Margins: EBITDA | 26.54% | 25.16% | 23.80% |
| Margins: Gross | 33.40% | 32.37% | 30.11% |
| R&D to Revenue | 0% | 0% | 0% |
The strong profitability metrics of Globe Life indicate efficiency in generating earnings relative to the capital employed.
📈 Price Development
✅ Dividend Scoring System
| Criteria | Points | Score |
|---|---|---|
| Dividend yield | 2 | |
| Dividend Stability | 5 | |
| Dividend growth | 3 | |
| Payout ratio | 5 | |
| Financial stability | 4 | |
| Dividend continuity | 5 | |
| Cashflow Coverage | 4 | |
| Balance Sheet Quality | 4 |
Overall Score: 32/40
🌟 Rating
Globe Life Inc. deserves commendation for its unwavering dividend distribution record, emphasizing stability and a sustainable payout policy. Its financial foundation supports continued dividend robustness, suggesting it as a prudent choice for risk-averse, income-focused investors.
Smart Data Insight
Master the Perfect Entry & Exit for this Stock
Don't leave your profits to chance. Historically, this stock follows specific seasonal patterns that institutional traders use to maximize returns.
- ✅ Identify the "Golden Buying Window"
- ✅ Avoid high-risk correction cycles
- ✅ Backtested data from the last 20+ years