March 25, 2026 a 02:47 am

GL: Dividend Analysis - Globe Life Inc.
Globe Life Inc. operates in a manner that ensures consistent dividend returns, indicated by over four decades of uninterrupted dividend history. With strategic management, the company maintains a sustainable payout that aligns with its long-term growth strategies, reflected in its stable dividend yield. However, given the low dividend yield, investors might consider the overall growth prospects and financial health of the company to evaluate its investment potential.
📊 Overview
Globe Life Inc. operates within the financial services sector and has a well-established track record for delivering dividends to its shareholders. Below is an overview of some key metrics:
| Metric | Value |
|---|---|
| Sector | Financial Services |
| Dividend Yield | 0.82% |
| Current Dividend Per Share | 1.06 USD |
| Dividend History | 41 years |
| Last Cut or Suspension | None |
🗣️ Dividend History
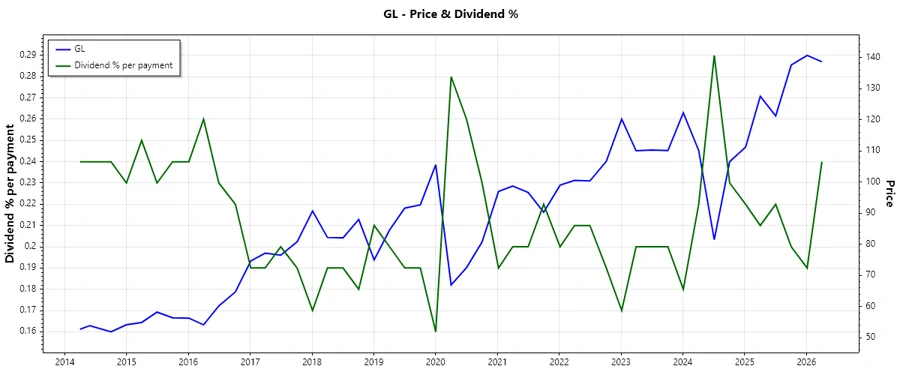
Globe Life Inc.'s rich dividend history mirrors its financial resilience and commitment to returning value to shareholders. Understanding dividend history is crucial as it highlights the company's capability to sustain and possibly increase dividend payouts over time.
| Year | Dividend Per Share (USD) |
|---|---|
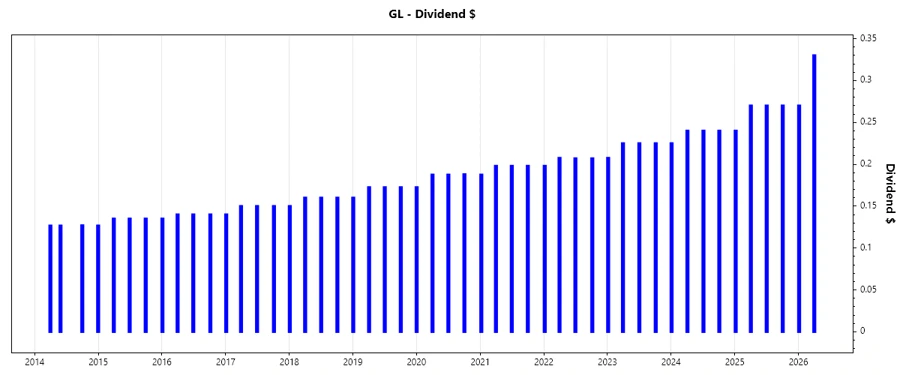
| 2026 | 0.60 |
| 2025 | 1.05 |
| 2024 | 0.945 |
| 2023 | 0.8825 |
| 2022 | 0.8195 |
📈 Dividend Growth
Analyzing dividend growth is essential for understanding the company's strategy for enhancing shareholder value. Below is a look at the growth rates:
| Time | Growth |
|---|---|
| 3 years | 8.61% |
| 5 years | 7.38% |
The average dividend growth is 7.38% over 5 years. This shows moderate but steady dividend growth.
⚠️ Payout Ratio
The payout ratio provides insights into how much of the company's earnings are being distributed as dividends. A lower payout ratio might suggest more room for growth, while a higher ratio could indicate limited growth potential.
| Key Figure | Ratio |
|---|---|
| EPS-based | 7.41% |
| Free Cash Flow-based | 6.68% |
The low payout ratios, both EPS-based at 7.41% and FCF-based at 6.68%, indicate ample space for further dividend growth without straining the company's finances.
💰 Cashflow & Capital Efficiency
Cash flows and capital efficiency metrics are pivotal to assessing a company's operational health and capacity to sustain dividends. Here are the key figures from recent years:
| Metric | 2023 | 2024 | 2025 |
|---|---|---|---|
| Free Cash Flow Yield | 12.38% | 14.22% | 11.09% |
| Earnings Yield | 8.39% | 11.44% | 10.27% |
| CAPEX to Operating Cash Flow | 3.34% | 5.07% | 10.20% |
| Stock-based Compensation to Revenue | 0% | 0% | 0% |
| Free Cash Flow / Operating Cash Flow Ratio | 96.66% | 94.93% | 89.80% |
The cash flow metrics suggest a robust ability to generate cash. The high free cash flow yield indicates strong potential for further reinvestments or dividend enhancements.
📉 Balance Sheet & Leverage Analysis
A strong balance sheet with prudent leverage is essential for sustaining long-term dividend payments. The following are key leverage and liquidity ratios:
| Metric | 2023 | 2024 | 2025 |
|---|---|---|---|
| Debt-to-Equity | 0.47 | 0.52 | 0.44 |
| Debt-to-Assets | 0.08 | 0.09 | 0.09 |
| Debt-to-Capital | 0.32 | 0.34 | 0.31 |
| Net Debt to EBITDA | 1.55 | 1.77 | 1.56 |
| Current Ratio | 10.83 | 9.48 | 9.66 |
| Quick Ratio | 10.83 | 9.48 | 9.66 |
| Financial Leverage | 6.25 | 5.48 | 5.16 |
The company's leverage is managed prudently, with robust liquidity buffers, as shown by high current and quick ratios.
✅ Fundamental Strength & Profitability
These fundamental metrics highlight the company's efficiency and profitability, which underpin its dividend-paying capacity:
| Metric | 2023 | 2024 | 2025 |
|---|---|---|---|
| Return on Equity | 21.64% | 20.18% | 19.43% |
| Return on Assets | 3.46% | 3.68% | 3.77% |
| Margins: Net | 17.82% | 18.53% | 19.36% |
| Margins: EBIT | 23.80% | 25.16% | 26.54% |
| Margins: EBITDA | 23.80% | 25.16% | 26.54% |
| Margins: Gross | 30.11% | 32.37% | 33.40% |
| R&D to Revenue | 0% | 0% | 0% |
With robust profitability metrics such as a high return on equity and solid margins, the company demonstrates an efficient use of capital, supporting a sustainable dividend strategy.
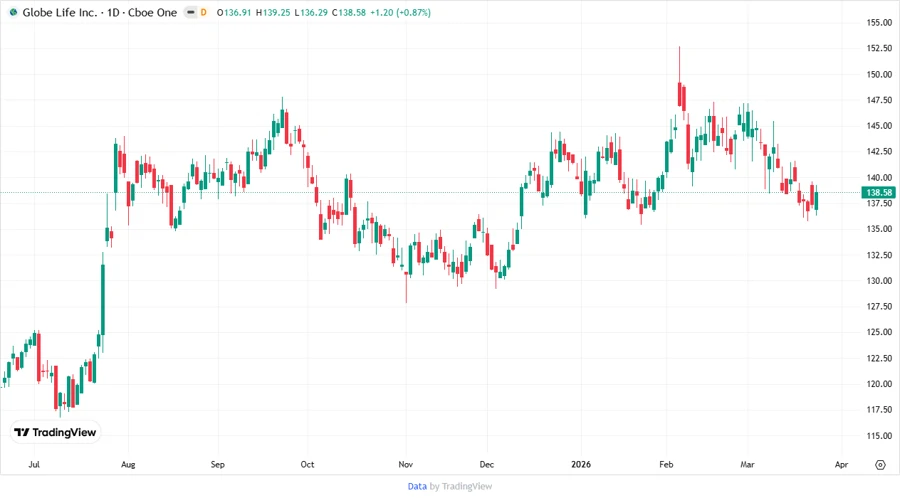
📈 Price Development
🔍 Dividend Scoring System
| Criteria | Score | Bar |
|---|---|---|
| Dividend Yield | 3 | |
| Dividend Stability | 5 | |
| Dividend Growth | 4 | |
| Payout Ratio | 5 | |
| Financial Stability | 5 | |
| Dividend Continuity | 5 | |
| Cashflow Coverage | 4 | |
| Balance Sheet Quality | 5 |
Total Score: 36/40
🌟 Rating
Globe Life Inc. stands out as a stable and reliable dividend payer with a commendable track record of continuous payouts and dividends growing at a moderate pace. While the yield might be on the lower side, the security of capital and the strong financial position enhance its attractiveness to investors seeking steady income with low risk. It is recommended for investors prioritizing capital preservation along with moderate income growth.