February 06, 2026 a 11:31 am

GL: Dividend Analysis - Globe Life Inc.
Globe Life Inc. (GL) presents a unique dividend profile with a long-standing history of payments. Despite a relatively low dividend yield, the consistent growth over decades and substantial capital allocation towards dividends exhibits a commitment to rewarding shareholders.
📊 Overview
Globe Life Inc. operates within the insurance sector, which is typically known for stability and predictable cash flows. The company offers a modest dividend yield of 0.77%, reflecting a strategic retention of earnings for growth while maintaining a 40-year dividend history without cuts.
| Detail | Value |
|---|---|
| Sector | Insurance |
| Dividend yield | 0.77 % |
| Current dividend per share | 0 USD |
| Dividend history | 40 years |
| Last cut or suspension | None |
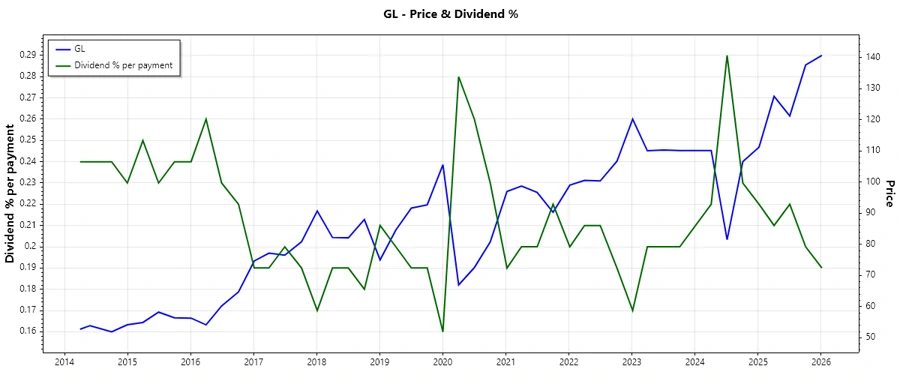
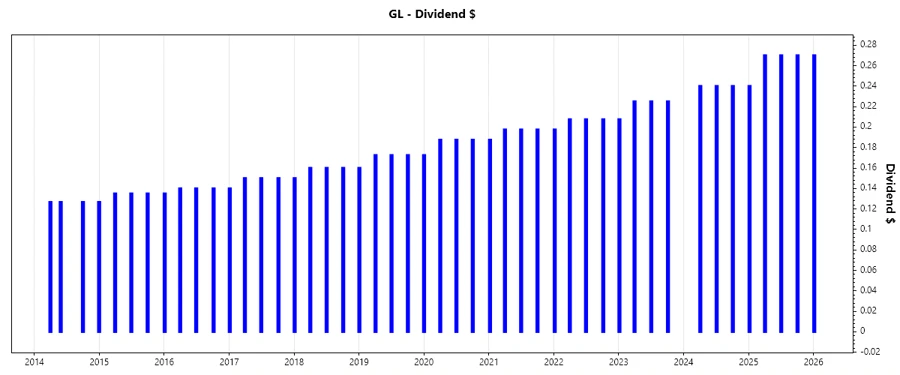
🗣️ Dividend History
The dividend history is critical when assessing the reliability of future payments. Consistency over 40 years is illustrative of the company's disciplined approach to shareholder returns.
| Year | Dividend per share (USD) |
|---|---|
| 2026 | 0.27 |
| 2025 | 1.05 |
| 2024 | 0.72 |
| 2023 | 0.8825 |
| 2022 | 0.8200 |
📈 Dividend Growth
Dividend growth rates are a strong indicator of future earning power and the company's ability to increase shareholder returns. Globe Life's dividend growth of 8.59% over 3 years and 7.39% over 5 years indicates a steady upward trend.
| Time | Growth |
|---|---|
| 3 years | 8.59 % |
| 5 years | 7.39 % |
The average dividend growth is 7.39 % over 5 years. This shows moderate but steady dividend growth.
✅ Payout Ratio
The payout ratio, a measure of earnings paid as dividends, is crucial to assess sustainability. GL maintains a conservative payout structure with minimal payout ratios indicating substantial room for maintaining or increasing dividends even during profit fluctuations.
| Key figure | Ratio |
|---|---|
| EPS-based | 0 % |
| Free cash flow-based | 0 % |
The payout ratios suggest that Globe Life is highly conservative with its earnings distribution strategy, preserving significant capital to maintain financial health.
💰 Cashflow & Capital Efficiency
Understanding cash flow efficiency measures is critical for assessing the company's operational effectiveness. Globe Life demonstrates strong cash generation capabilities and prudent capital spending.
| Measure | 2023 | 2024 | 2025 |
|---|---|---|---|
| Free Cash Flow Yield | 12.38 % | 14.22 % | - |
| Earnings Yield | 8.39 % | 11.44 % | - |
| CAPEX to Operating Cash Flow | 3.34 % | 5.07 % | - |
| Stock-based Compensation to Revenue | 0 % | 0 % | - |
| Free Cash Flow / Operating Cash Flow Ratio | 96.66 % | 94.93 % | - |
The cash flow stability shows that Globe Life manages its capital efficiently, ensuring continued investment capacity and shareholder returns.
📉 Balance Sheet & Leverage Analysis
Analyzing the balance sheet provides insights into the company's financial health and debt management capabilities. Globe Life maintains robust leverage ratios, implying effective debt utilization relative to equity.
| Measure | 2023 | 2024 | 2025 |
|---|---|---|---|
| Debt-to-Equity | 47.15 % | 51.64 % | - |
| Debt-to-Assets | 7.54 % | 9.42 % | - |
| Debt-to-Capital | 32.04 % | 34.05 % | - |
| Net Debt to EBITDA | 1.55 | 1.77 | - |
| Current Ratio | 0 | 79.71 % | - |
| Quick Ratio | 79.92 % | 79.71 % | - |
| Financial Leverage | 625.20 % | 548.04 % | - |
Globe Life exhibits a strong financial structure, with leverage aligned optimally for strategic growth, balancing debt and equity effectively.
🗣️ Fundamental Strength & Profitability
Profitability metrics reflect operational success and overall financial strength. Globe Life maintains healthy return ratios, indicating strong management and market positioning.
| Measure | 2023 | 2024 | 2025 |
|---|---|---|---|
| Return on Equity | 21.64 % | 20.18 % | - |
| Return on Assets | 3.46 % | 3.68 % | - |
| Margins: Net | 17.82 % | 18.53 % | - |
| Margins: EBIT | 23.80 % | 25.16 % | - |
| Margins: EBITDA | 23.80 % | 25.16 % | - |
| Margins: Gross | 30.11 % | 32.37 % | - |
| Research & Development to Revenue | 0 % | 0 % | - |
These metrics highlight Globe Life's efficiency in generating returns on investment, underscoring their competitive advantage in the insurance industry.
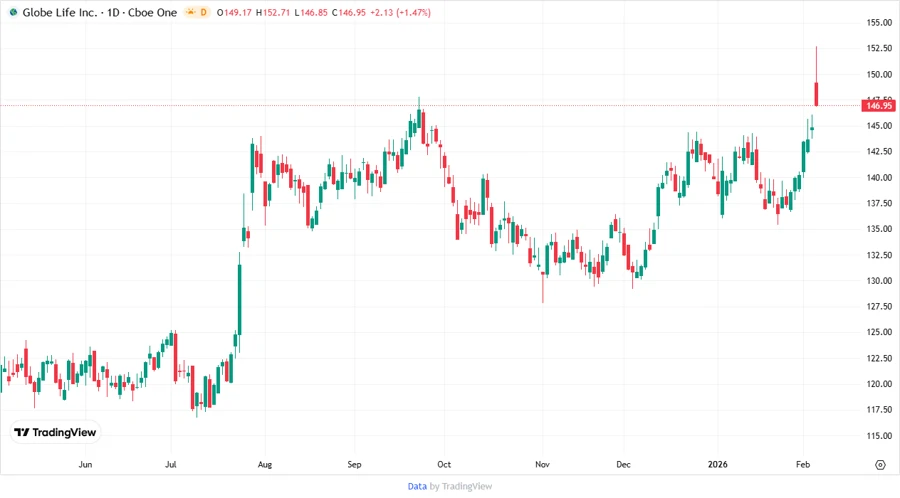
Price Development
🏆 Dividend Scoring System
Our bespoke scoring system evaluates Globe Life's dividend-paying ability across several metrics:
| Criterion | Score | Score Bar |
|---|---|---|
| Dividend yield | 2 | |
| Dividend Stability | 5 | |
| Dividend growth | 4 | |
| Payout ratio | 3 | |
| Financial stability | 4 | |
| Dividend continuity | 5 | |
| Cashflow Coverage | 4 | |
| Balance Sheet Quality | 3 |
Overall Score: 30/40
🔍 Rating
Globe Life Inc. is recommended as a stable investment for income-focused portfolios given its unabated dividend history and financial robustness. However, potential investors should view its present modest yield in context of strategic growth potential and prudent financial management.