February 03, 2026 a 07:46 am


GL: Dividend Analysis - Globe Life Inc.
Globe Life Inc. presents a strong investment opportunity with its consistent dividend track record and moderate growth outlook. The company has demonstrated resilience with 40 years of uninterrupted dividend payments, showcasing reliability for income-focused investors. However, the relatively modest dividend yield necessitates a focus on long-term gain through dividend growth and market stability.
📊 Overview
Globe Life Inc. operates within a stable sector, providing a dependable, albeit low, dividend yield. The company's consistency in dividend payments over the last four decades underscores its financial robustness.
| Metric | Value |
|---|---|
| Sector | Insurance |
| Dividend Yield | 0.77% |
| Current Dividend per Share | 1.02 USD |
| Dividend History | 40 years |
| Last Cut or Suspension | None |
🗣️ Dividend History
Globe Life's longstanding dividend history highlights the company's dedication to returning value to shareholders. Consistent payouts demonstrate financial health and commitment to reward investors.
| Year | Dividend per Share (USD) |
|---|---|
| 2026 | 0.27 |
| 2025 | 1.05 |
| 2024 | 0.72 |
| 2023 | 0.8825 |
| 2022 | 0.82 |
📈 Dividend Growth
The dividend growth rates offer insight into the company's future financial health. Steady growth rates suggest potential for increased returns and investor confidence.
| Time | Growth |
|---|---|
| 3 years | 8.59% |
| 5 years | 7.39% |
The average dividend growth is 7.39% over 5 years. This shows moderate but steady dividend growth.
📉 Payout Ratio
Payout ratios provide insight into the sustainability of dividends relative to earnings and cash flow. Low payout ratios suggest flexibility in maintaining or increasing dividends.
| Key Figure Ratio | |
|---|---|
| EPS-based | 7.39% |
| Free Cash Flow-based | 6.51% |
With an EPS payout ratio of 7.39% and a FCF payout ratio of 6.51%, Globe Life Inc.'s dividend payments are highly sustainable and leave room for potential increases.
💰 Cashflow & Capital Efficiency
The company's capital efficiency and cash flow management are critical for supporting sustainable dividends and funding growth initiatives. High free cash flow yield indicates solid cash generation capability.
| Metric | 2024 | 2023 | 2022 |
|---|---|---|---|
| Free Cash Flow Yield | 14.22% | 12.38% | 11.81% |
| Earnings Yield | 11.44% | 8.39% | 7.58% |
| CAPEX to Operating Cash Flow | 5.07% | 3.34% | 1.96% |
| Stock-based Compensation to Revenue | 0% | 0% | 0% |
| Free Cash Flow / Operating Cash Flow Ratio | 94.93% | 96.66% | 98.04% |
Globe Life Inc.'s cash flow stability and capital efficiency demonstrate its capability to continue supporting dividends and reinvestment without financial strain.
🏦 Balance Sheet & Leverage Analysis
An analysis of balance sheet leverage ratios can inform stakeholders about the company's debt levels and financial health. Low debt ratios suggest prudent financial management and reduced risk.
| Ratio | 2024 | 2023 | 2022 |
|---|---|---|---|
| Debt-to-Equity | 51.64% | 47.15% | 52.59% |
| Debt-to-Assets | 9.42% | 7.54% | 7.99% |
| Debt-to-Capital | 34.05% | 32.04% | 34.46% |
| Net Debt to EBITDA | 1.77 | 1.55 | 1.66 |
| Current Ratio | 0 | 0 | 0 |
| Quick Ratio | 0 | 0 | 0 |
| Financial Leverage | 5.48 | 6.25 | 6.58 |
The company exhibits a sound balance sheet with manageable leverage, contributing to its financial stability and capability for dividend continuity.
📈 Fundamental Strength & Profitability
Higher profitability ratios generally indicate a company’s superior business model and operational efficiency. Consistent ROE and margins suggest effective management and competitive advantages.
| Metric | 2024 | 2023 | 2022 |
|---|---|---|---|
| Return on Equity | 20.18% | 21.64% | 22.65% |
| Return on Assets | 3.68% | 3.46% | 3.44% |
| Net Margin | 18.53% | 17.82% | 17.11% |
| EBIT Margin | 25.16% | 23.80% | 22.82% |
| EBITDA Margin | 25.16% | 23.80% | 22.82% |
| Gross Margin | 32.37% | 30.11% | 29.49% |
| R&D to Revenue | 0% | 0% | 0% |
Globe Life Inc.'s profitability and return metrics signify its ability to generate consistent returns and maintain robust financial performance.
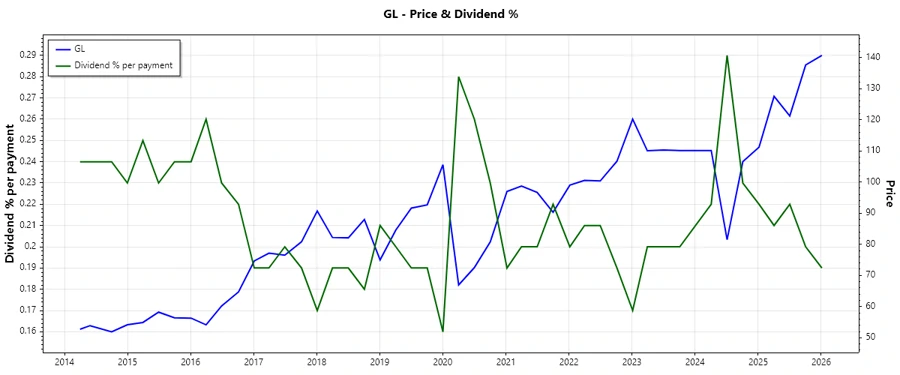
📈 Price Development
📊 Dividend Scoring System
| Category | Score | Visual Representation |
|---|---|---|
| Dividend Yield | 3 | |
| Dividend Stability | 5 | |
| Dividend Growth | 4 | |
| Payout Ratio | 5 | |
| Financial Stability | 4 | |
| Dividend Continuity | 5 | |
| Cashflow Coverage | 5 | |
| Balance Sheet Quality | 4 |
Total Score: 35/40
✅ Rating
Globe Life Inc. receives a favorable dividend rating due to its strong track record of payments and stability, despite a lower yield. Recommended for investors pursuing steady income and long-term growth.