January 21, 2026 a 03:31 am

GL: Dividend Analysis - Globe Life Inc.
Globe Life Inc. exhibits a modest dividend yield but compensates with a stable and growing dividend history. The company maintains a disciplined payout strategy, ensuring a sustainable dividend policy with steady growth. Its robust financial metrics underscore its ability to continue delivering returns to shareholders over the long term.
📊 Overview
Globe Life Inc. operates within the Life & Health Insurance sector, a segment known for cash flow stability and defensive characteristics. The company has achieved a dividend yield of 0.768%, with a current dividend per share of $1.018. Despite the lower yield, its impressive 40-year dividend history without any recent cuts or suspensions reflects a commitment to long-term shareholder returns.
| Metric | Value |
|---|---|
| Sector | Life & Health Insurance |
| Dividend Yield | 0.768% |
| Current Dividend Per Share | $1.018 |
| Dividend History | 40 years |
| Last Cut or Suspension | None |
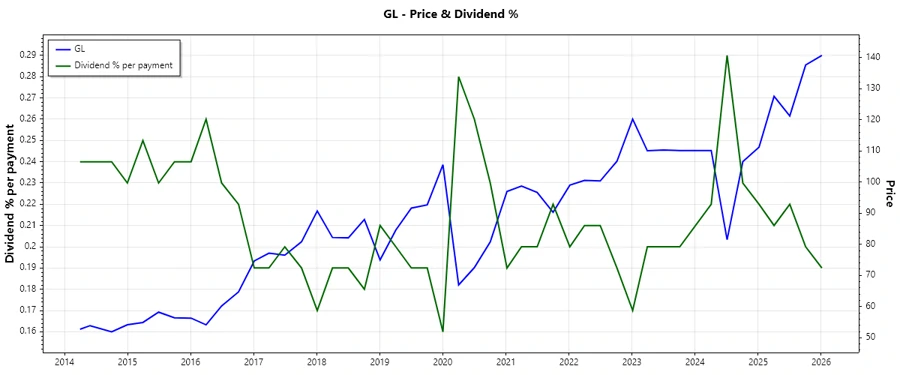
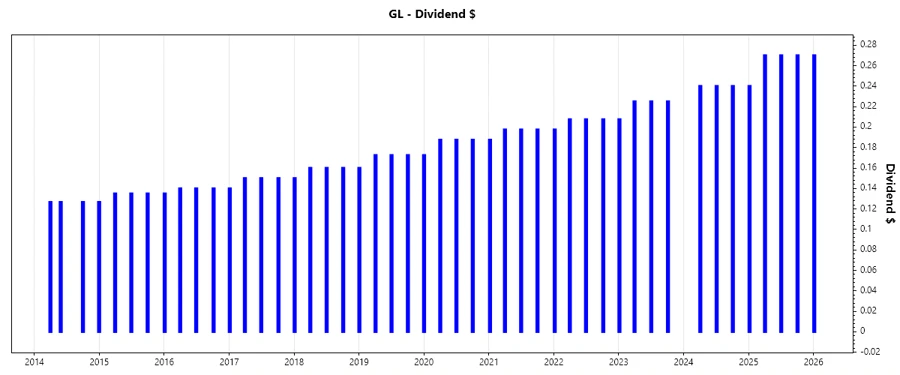
🗣️ Dividend History
Globe Life's consistent dividend history is a testament to its strong operational performance and shareholder commitment. The ability to maintain and grow dividends over decades showcases resilience, financial health, and a strategic focus on shareholder returns.
| Year | Dividend per Share (USD) |
|---|---|
| 2026 | 0.27 |
| 2025 | 1.05 |
| 2024 | 0.72 |
| 2023 | 0.8825 |
| 2022 | 0.8200 |
📈 Dividend Growth
Monitoring dividend growth offers insights into a company's forward-looking financial strategy and its commitment to enhancing shareholder value. Globe Life's 3-year dividend growth is 8.59%, while the 5-year growth is 7.39%. Such growth signifies steady progress, supporting compound returns for investors.
| Time | Growth |
|---|---|
| 3 years | 8.59% |
| 5 years | 7.39% |
The average dividend growth is 7.39% over 5 years. This shows moderate but steady dividend growth.
✅ Payout Ratio
The payout ratio indicates the proportion of earnings paid to shareholders as dividends, reflecting sustainability. Globe Life's EPS-based payout ratio is at 7.39%, and its free cash flow-based (FCF) payout ratio is 6.51%. These figures demonstrate a conservative payout strategy, highlighting potential for future dividend growth while maintaining robust financial reserves.
| Key Figure | Ratio |
|---|---|
| EPS-based | 7.39% |
| Free cash flow-based | 6.51% |
With the EPS payout ratio at 7.39% and FCF payout at 6.51%, Globe Life Inc. retains ample earnings for reinvestment, safeguarding its earnings stability.
💰 Cashflow & Capital Efficiency
Measuring cash flow efficiency and capital allocation strategies is critical for long-term profitability. Metrics such as the Free Cash Flow Yield of 11.42% and the CAPEX to Operating Cash Flow ratio of 9.91% underscore cash generation efficiency, supporting ongoing operations and future growth initiatives.
| Year | 2024 | 2023 | 2022 |
|---|---|---|---|
| Free Cash Flow Yield | 14.22% | 12.38% | 11.81% |
| Earnings Yield | 11.44% | 8.39% | 7.58% |
| CAPEX to Operating Cash Flow | 5.07% | 3.34% | 1.96% |
| Stock-based Compensation to Revenue | 0% | 0% | 0% |
| Free Cash Flow / Operating Cash Flow Ratio | 94.93% | 96.66% | 98.04% |
Globe Life's stable cash flow and efficient capital allocation reflect its financial prudence, ensuring robust capital returns.
⚖️ Balance Sheet & Leverage Analysis
Evaluating balance sheet strength and leverage informs about financial resilience and risk profile. Globe Life's Debt-to-Equity ratio of 51.64% and a manageable Net Debt to EBITDA of 1.55x indicate a balanced capital structure, promoting sustainable growth.
| Year | 2024 | 2023 | 2022 |
|---|---|---|---|
| Debt-to-Equity | 51.64% | 47.15% | 52.59% |
| Debt-to-Assets | 9.42% | 7.54% | 7.99% |
| Debt-to-Capital | 34.05% | 32.04% | 34.46% |
| Net Debt to EBITDA | 1.77 | 1.55 | 1.66 |
| Current Ratio | 0 | 0 | 0 |
| Quick Ratio | 0 | 0 | 0 |
| Financial Leverage | 5.48 | 6.25 | 6.58 |
Globe Life's sound leverage strategy supports operational flexibility while maintaining financial integrity.
🪙 Fundamental Strength & Profitability
Profitability metrics assess operational efficiency and value generation. A Return on Equity of 21.07% and a significant EBIT margin highlight Globe Life's effective utilization of assets and strong competitive standing.
| Year | 2024 | 2023 | 2022 |
|---|---|---|---|
| Return on Equity | 20.18% | 21.64% | 22.65% |
| Return on Assets | 3.68% | 3.46% | 3.44% |
| Margins: Net | 18.53% | 17.82% | 17.11% |
| Margins: EBIT | 25.16% | 23.80% | 22.82% |
| Margins: EBITDA | 25.16% | 23.80% | 22.82% |
| Margins: Gross | 32.37% | 30.11% | 29.49% |
| Research & Development to Revenue | 0% | 0% | 0% |
Globe Life's high-profit margins and healthy returns on equity and assets underscore its operational efficiency and competitive advantages.
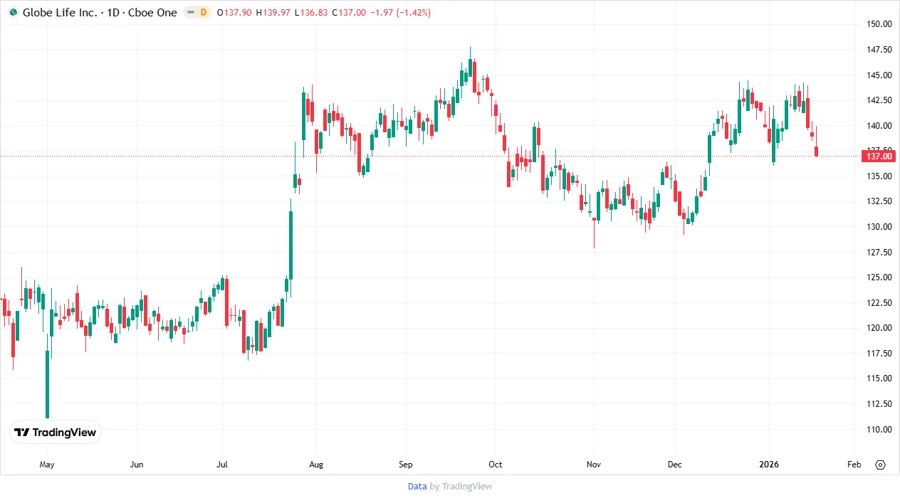
📉 Price Development
🏆 Dividend Scoring System
| Category | Score | Score Bar |
|---|---|---|
| Dividend Yield | 3 | |
| Dividend Stability | 5 | |
| Dividend Growth | 4 | |
| Payout Ratio | 5 | |
| Financial Stability | 4 | |
| Dividend Continuity | 5 | |
| Cashflow Coverage | 4 | |
| Balance Sheet Quality | 4 |
Total Score: 34/40
🌟 Rating
Globe Life Inc. maintains a strong dividend profile with robust growth and stability anchored by solid financials. Investors seeking reliable dividend income with potential growth should consider Globe Life a viable addition to their portfolios. The company's total dividend score of 34 out of 40 reflects its commitment to shareholder value, supported by sound financial strategies and consistent dividend practices.