
June 20, 2026 a 03:15 am

GLW: Trend and Support & Resistance Analysis - Corning Incorporated
Corning Incorporated, with its extensive operations in display technologies, optical communications, environmental solutions, specialty materials, and life sciences, remains a key player in the technology sector. The stock has demonstrated significant volatility, reflecting its diverse market presence and innovation drive. Currently, the market's focus is on how Corning can leverage its technological advancements and strategic positioning to maintain its competitive edge amidst economic fluctuations.
Trend Analysis
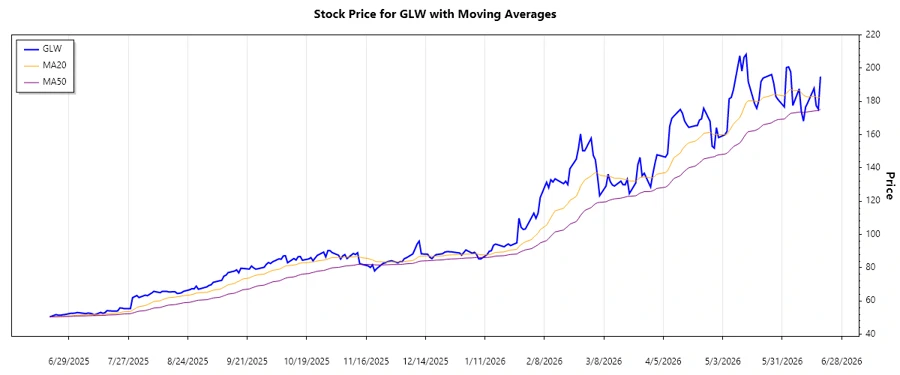
The technical analysis of the recent price data for Corning Incorporated reveals a dynamic market behavior. By calculating the Exponential Moving Averages (EMA), we can observe short-term market trends. The EMA20 and EMA50 are crucial indicators for trend identification.
| Date | Close Price | Trend |
|---|---|---|
| 2026-06-18 | $194.92 | ▲ |
| 2026-06-17 | $175.40 | ▼ |
| 2026-06-16 | $177.42 | ▲ |
| 2026-06-15 | $187.88 | ▲ |
| 2026-06-12 | $179.20 | ▲ |
| 2026-06-11 | $176.55 | ▼ |
| 2026-06-10 | $168.17 | ▼ |
Current trends suggest that the stock is exhibiting a series of fluctuations between minor resistance and support levels. The EMA20 surpassing EMA50 indicates a potential upward trend; however, continued market monitoring is essential.
Support- and Resistance
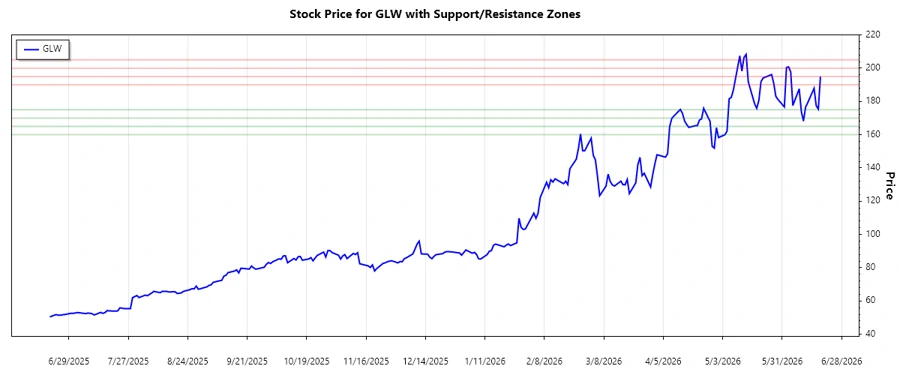
Identifying critical support and resistance zones assists investors in making informed buying or selling decisions. Based on the recent data, we've identified the following zones:
| Zone Type | From | To |
|---|---|---|
| Support | $170.00 | $175.00 |
| Support | $160.00 | $165.00 |
| Resistance | $190.00 | $195.00 |
| Resistance | $200.00 | $205.00 |
The current closing price is near the upper region of the identified resistance zones. This suggests close monitoring for potential breakout or reversal signals. Technically, this indicates a testing phase within a defined price range.
Conclusion
Corning Incorporated's stock exhibits a dynamic market presence, leveraging its extensive technological portfolio and innovation capacity. The identified trend suggests potential upward momentum, although market volatility may introduce risks. The stock's current resistance zones indicate potential for either breakout movement or consolidation. Continuous monitoring of EMAs and support/resistance levels is recommended to capitalize on investment opportunities while managing risk effectively.
Smart Data Insight
Master the Perfect Entry & Exit for this Stock
Don't leave your profits to chance. Historically, this stock follows specific seasonal patterns that institutional traders use to maximize returns.
- ✅ Identify the "Golden Buying Window"
- ✅ Avoid high-risk correction cycles
- ✅ Backtested data from the last 20+ years