May 09, 2026 a 09:03 am
GLW: Trend and Support & Resistance Analysis - Corning Incorporated
Corning Incorporated has shown significant market movements over the past months. The latest data indicate a recovery phase following prior declines. Analysts should consider the current price action in the context of historical fluctuations in the optical communications and specialty materials sectors. This report will delve into the technical structure, providing insights into trends and pivotal zones on the chart.
Trend Analysis
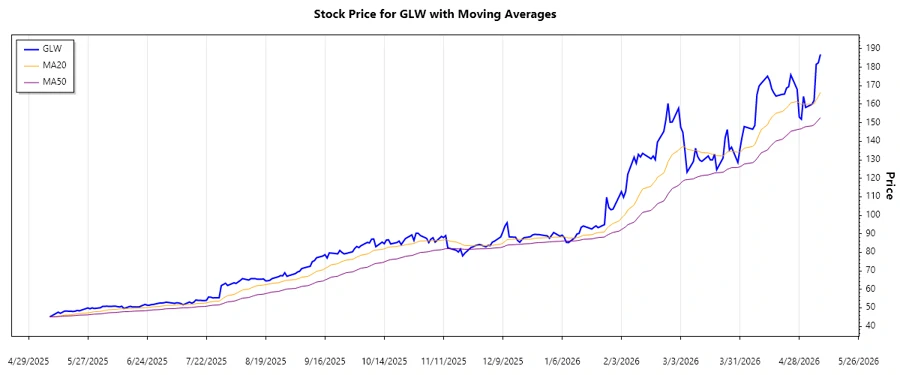
The analysis of the last few months shows that there's been a shift in dynamics. Based on the closing prices, the Exponential Moving Averages (EMA20 and EMA50) are calculated to be as follows:
| Date | Closing Price | Trend |
|---|---|---|
| 2026-05-08 | 186.94 | ▲ Uptrend |
| 2026-05-07 | 182.4 | ▲ Uptrend |
| 2026-05-06 | 181.57 | ▲ Uptrend |
| 2026-05-05 | 162.1 | ▲ Uptrend |
| 2026-05-04 | 159.96 | ▲ Uptrend |
| 2026-05-01 | 158.26 | ▲ Uptrend |
| 2026-04-30 | 164.24 | ▲ Uptrend |
The EMA20 is above the EMA50, indicating a prevailing uptrend. Recent price movements suggest bullish sentiment reverting from earlier lows.
Support- and Resistance
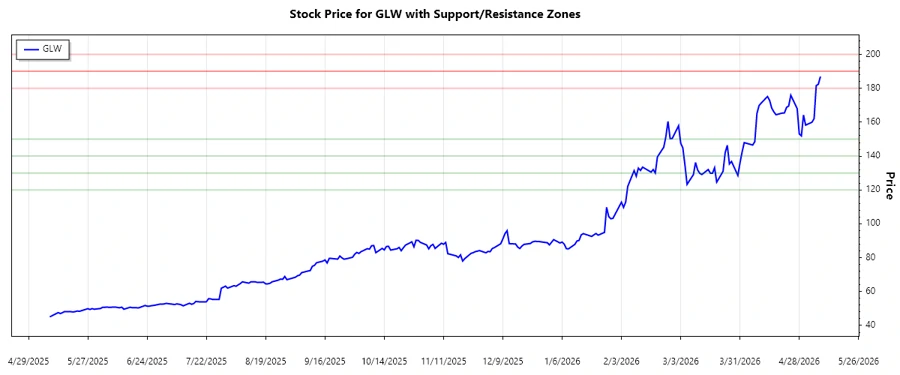
Based on recent historical closing prices, the following support and resistance zones have been identified:
| Zone Type | From | To | |
|---|---|---|---|
| Support | 120.00 | 130.00 | ▲ |
| Support | 140.00 | 150.00 | ▲ |
| Resistance | 190.00 | 200.00 | ▼ |
| Resistance | 180.00 | 190.00 | ▼ |
Currently, the price is near the upper resistance zone, suggesting a potential challenge in surpassing this level without significant bullish momentum.
Conclusion
Corning Incorporated is experiencing a strong upward bounce reflecting improved market sentiments. However, the potential challenges lie in breaking above the current resistance level. Should the stock maintain its recent bullish trend and breakthrough the pivotal resistance, it could signal further upward potential. Conversely, a failure to break out might see the price oscillating between established support and resistance zones. While the trend momentum is positive, cautious optimism is advised amidst market fluctuations.
Smart Data Insight
Master the Perfect Entry & Exit for this Stock
Don't leave your profits to chance. Historically, this stock follows specific seasonal patterns that institutional traders use to maximize returns.
- ✅ Identify the "Golden Buying Window"
- ✅ Avoid high-risk correction cycles
- ✅ Backtested data from the last 20+ years