
July 26, 2026 a 06:44 am
GLW: Fibonacci Analysis - Corning Inc
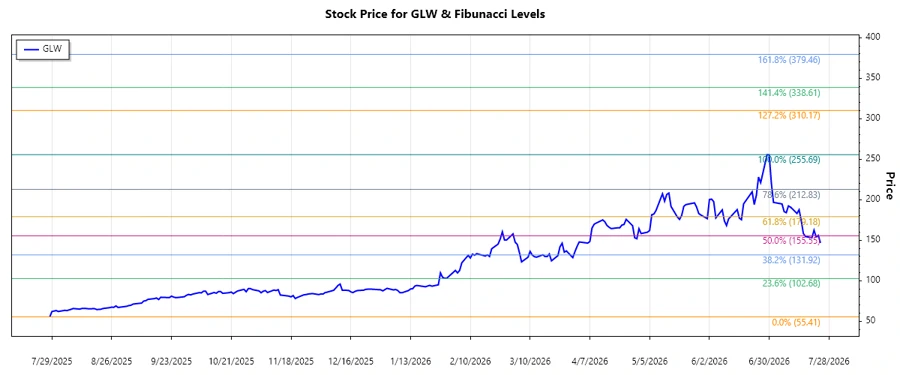
Corning Inc. has demonstrated significant volatility over the past months, primarily driven by its diverse operations in high-demand sectors such as optical communications and specialty materials. The stock has seen substantial fluctuations, which might attract both investors looking for growth opportunities and those wary of risks. Past performance highlights an apparent ability to recover from dips, potentially promising for stakeholders anticipating continued innovation and market adaptation.
Fibonacci Analysis
| Details | Information |
|---|---|
| Trend Period | 2025-07-28 to 2026-06-30 |
| High Point | $255.69 on 2026-06-29 |
| Low Point | $55.41 on 2025-07-28 |
| Fibonacci Level | Price Level |
|---|---|
| 0.236 | $109.57 |
| 0.382 | $136.53 |
| 0.5 | $155.55 |
| 0.618 | $174.57 |
| 0.786 | $197.15 |
The current price of $146.65 is not within any significant retracement zone but is hovering below the 0.382 level. This indicates potential resistance ahead, with possible support closer to the 0.236 level should there be a retracement.
Conclusion
In summary, Corning Inc. presents both risks and rewards in its current standing. The recent peak and drop suggest areas of strong resistance and support levels, guiding future investment decisions. Analysts might see potential buying opportunities at retracement lows, while caution should be taken due to ongoing volatility. Overall, the technical analysis shows Corning is poised at a critical junction that will likely influence its near-term movement significantly.
Smart Data Insight
Master the Perfect Entry & Exit for this Stock
Don't leave your profits to chance. Historically, this stock follows specific seasonal patterns that institutional traders use to maximize returns.
- ✅ Identify the "Golden Buying Window"
- ✅ Avoid high-risk correction cycles
- ✅ Backtested data from the last 20+ years