April 15, 2026 a 03:31 am

GLW: Dividend Analysis - Corning Incorporated
Corning Incorporated maintains a stable dividend profile with a history of 40 years of payouts. Although its current yield of 0.74% appears modest, the company demonstrates consistent growth in its dividends per share, reflecting a reliable income stream for investors. Understanding the implications of its payout ratios and growth patterns is key in assessing its future potential.
📊 Overview
Corning Incorporated operates in the tech manufacturing sector, characterized by capital-intensive operations. Its dividend yield stands at 0.74%. With a dividend history spanning 40 years, the firm reflects stability and reliability, crucial for dividend-focused investors. The latest dividend per share is $1.16.
| Key Metrics | Details |
|---|---|
| Sector | Tech Manufacturing |
| Dividend yield | 0.74% |
| Current dividend per share | $1.16 USD |
| Dividend history | 40 years |
| Last cut or suspension | None |
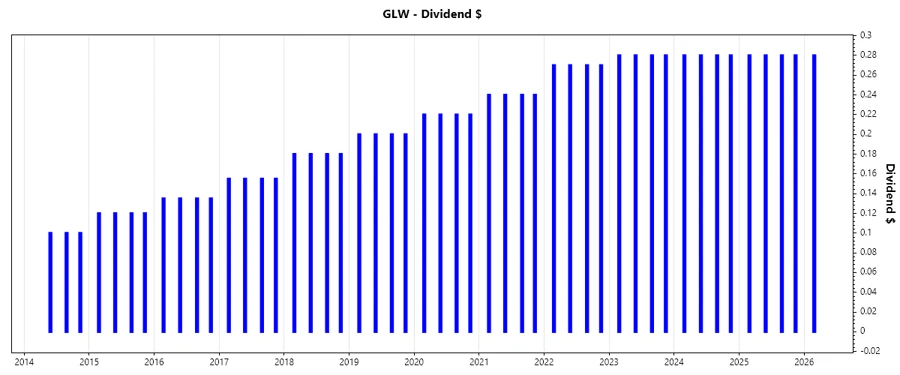
🗣️ Dividend History
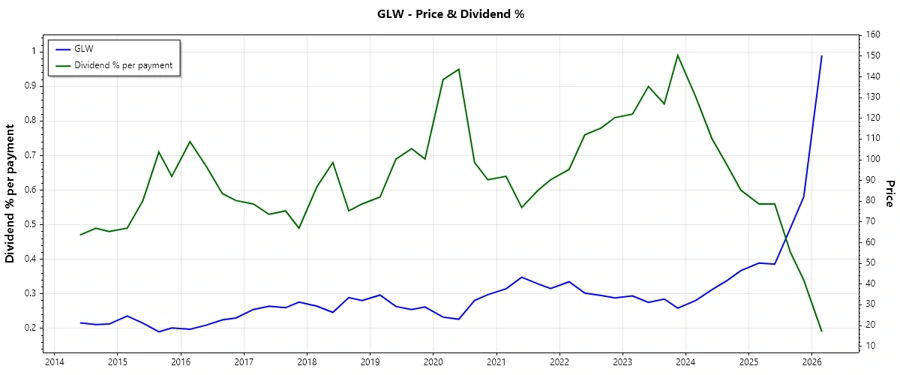
Corning Incorporated has shown consistent dividend payouts over the decades, serving as an anchor for long-term investment portfolios. This historical consistency is a positive signal for risk-averse dividend investors.
| Year | Dividend Per Share |
|---|---|
| 2026 | 0.28 |
| 2025 | 1.12 |
| 2024 | 1.12 |
| 2023 | 1.12 |
| 2022 | 1.08 |
📈 Dividend Growth
The growth in dividends is pivotal for safeguarding investor capital from inflationary pressures. With a 3-year growth rate of 1.22% and a 5-year growth rate of 4.94%, Corning demonstrates a steady uptick.
| Time | Growth |
|---|---|
| 3 years | 1.22% |
| 5 years | 4.94% |
The average dividend growth is 4.94% over 5 years. This shows moderate but steady dividend growth, indicating a positive outlook for future income increments.
⚖️ Payout Ratio
The payout ratio helps in determining the sustainability of a company's dividend. A payout ratio based on EPS at 62.59% and FCF at 70.62% indicates a balanced approach toward maintaining payouts while ensuring capital reinvestment capabilities.
| Key Figure | Ratio |
|---|---|
| EPS-based | 62.59% |
| Free cash flow-based | 70.62% |
📊 Cashflow & Capital Efficiency
Cash flow metrics reveal the ability of Corning to generate cash and allocate capital efficiently.
| Metric | 2025 | 2024 | 2023 |
|---|---|---|---|
| Free Cash Flow Yield | 1.88% | 2.40% | 2.38% |
| Earnings Yield | 2.12% | 1.25% | 2.25% |
| CAPEX to Operating Cash Flow | 47.57% | 49.77% | 69.33% |
| Stock-based Compensation to Revenue | 1.83% | 2.08% | 1.73% |
| Free Cash Flow / Operating Cash Flow Ratio | 52.43% | 50.23% | 30.67% |
⚠️ Balance Sheet & Leverage Analysis
Evaluating the balance sheet illuminates the financial health and risk structure of the company.
| Metric | 2025 | 2024 | 2023 |
|---|---|---|---|
| Debt-to-Equity | 86.58% | 75.72% | 73.45% |
| Debt-to-Assets | 33% | 29.17% | 29.77% |
| Debt-to-Capital | 46.40% | 43.09% | 42.35% |
| Net Debt to EBITDA | 2.33 | 2.54 | 2.67 |
| Current Ratio | 1.59 | N/A | N/A |
| Quick Ratio | 1.04 | 1.07 | 1.05 |
| Financial Leverage | 2.62 | 2.60 | 2.47 |
✅ Fundamental Strength & Profitability
Analysis of returns and margins provides insight into operational efficiency and profitability.
| Metric | 2025 | 2024 | 2023 |
|---|---|---|---|
| Return on Equity (ROE) | 13.52% | 4.74% | 5.03% |
| Return on Assets (ROA) | 5.15% | 1.82% | 2.04% |
| Net Margin | 10.21% | 3.86% | 4.62% |
| EBIT Margin | 15.28% | 8.71% | 9.10% |
| EBITDA Margin | 23.90% | 19.00% | 19.97% |
| Gross Margin | 35.28% | 32.60% | 31.23% |
| R&D to Revenue | 7.10% | 8.30% | 8.55% |
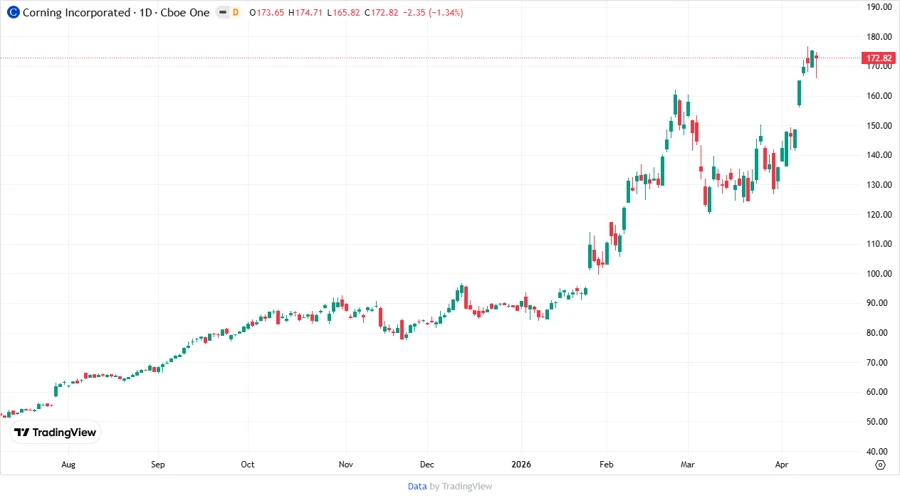
📉 Price Development
📊 Dividend Scoring System
| Criteria | Score | Score Bar |
|---|---|---|
| Dividend yield | 3 | |
| Dividend Stability | 4 | |
| Dividend growth | 4 | |
| Payout ratio | 3 | |
| Financial stability | 4 | |
| Dividend continuity | 5 | |
| Cashflow Coverage | 3 | |
| Balance Sheet Quality | 4 |
Total Score: 30 out of 40 points
🗒️ Rating
Based on the dividend analysis, Corning Incorporated is rated as a reliable income-generating investment, particularly suited for conservative investors. Though the dividend yield is relatively low, the company's robust dividend history and consistent growth rates combined with stable financial ratios underline its capacity to sustain and potentially enhance dividend payments in the future.
Smart Data Insight
Master the Perfect Entry & Exit for this Stock
Don't leave your profits to chance. Historically, this stock follows specific seasonal patterns that institutional traders use to maximize returns.
- ✅ Identify the "Golden Buying Window"
- ✅ Avoid high-risk correction cycles
- ✅ Backtested data from the last 20+ years