
March 16, 2026 a 11:31 am


GLW: Dividend Analysis - Corning Incorporated
Corning Incorporated exhibits a long-standing commitment to returning value to shareholders through a strong dividend history. With steady dividend growth over the years, Corning presents an encouraging option for income-focused investors. However, the relatively low dividend yield may not appeal to those seeking higher immediate returns. The company's robust financial metrics and capital efficiency further underscore its potential for sustained dividend payments. Its ability to maintain dividends without major cuts for 40 years highlights its resilience and operational strength.
Overview 📊
Corning Incorporated operates in the Technology sector, known for its innovative materials and optical communications solutions. The company's dividend profile reflects a manageable yield of 0.75%, with a current dividend per share of $1.16, underscoring its consistent shareholder returns over 40 years without recent cuts.
| Metric | Details |
|---|---|
| Sector | Technology |
| Dividend yield | 0.75 % |
| Current dividend per share | $1.16 USD |
| Dividend history | 40 years |
| Last cut or suspension | None |
Dividend History 📈
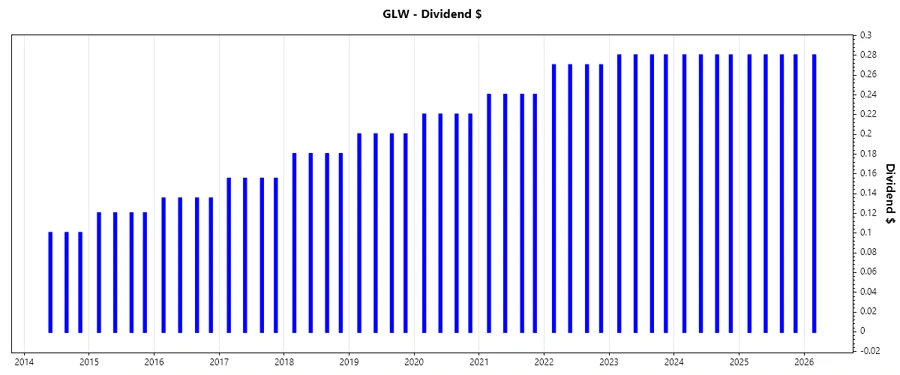
The continuity in Corning's dividend payments demonstrates stability and consistency, fundamental for investor confidence. Its historical resilience against market disruptions showcases management's commitment to shareholders.
| Year | Dividend per Share |
|---|---|
| 2026 | $0.28 |
| 2025 | $1.12 |
| 2024 | $1.12 |
| 2023 | $1.12 |
| 2022 | $1.08 |
Dividend Growth 📈
Dividend growth is a pivotal component of Corning's strategy, reflecting its profitability and earnings growth. Over 3 years, the dividend has grown by approximately 1.22%, while over 5 years, the growth stands at 4.94%, representing a modest yet consistent increase.
| Time | Growth |
|---|---|
| 3 years | 1.22 % |
| 5 years | 4.94 % |
The average dividend growth is 4.94% over 5 years. This shows moderate but steady dividend growth, reassuring investors of the company's long-term commitment to increasing shareholder returns.
Payout Ratio ✅
Paying dividends from earnings and free cash flow is pivotal for maintaining financial health while rewarding shareholders. Corning's EPS-based payout ratio is 62.59%, and FCF-based is 70.53%, indicating a sustainable approach. While these ratios suggest effective earnings utilization, maintaining these levels ensures future dividend payment reliability without straining financial reserves.
| Key Figure | Ratio |
|---|---|
| EPS-based | 62.59 % |
| Free cash flow-based | 70.53 % |
Efficient payout ratios such as 62.59% (EPS) and 70.53% (FCF) suggest Corning balances rewarding shareholders while supporting future growth and operations.
Cashflow & Capital Efficiency 💸
Corning's cash flow metrics indicate prudent management and strong capital allocation, essential for sustaining shareholder payouts and financing growth. A careful balance between cash generation and reinvestment bolsters operational resilience.
| Metric | 2023 | 2024 | 2025 |
|---|---|---|---|
| Free Cash Flow Yield | 2.38% | 2.40% | 1.88% |
| Earnings Yield | 2.25% | 1.25% | 2.11% |
| CAPEX to Operating Cash Flow | 0.69 | 0.50 | 0.48 |
| Stock-based Compensation to Revenue | 1.73% | 2.08% | 1.83% |
| Free Cash Flow / Operating Cash Flow Ratio | 30.67% | 50.23% | 52.43% |
Strong cash flow generation underscores Corning's ability to cover dividends and fund strategic initiatives, enhancing its capital efficiency and operational robustness.
Balance Sheet & Leverage Analysis 🏦
A comprehensive balance sheet and leverage analysis reveals Corning's conservative debt management and liquidity positioning, which are crucial to long-term financial stability. This solid foundation supports sustained dividend payouts and operational agility during economic uncertainties.
| Metric | 2023 | 2024 | 2025 |
|---|---|---|---|
| Debt-to-Equity | 0.73 | 0.76 | 0.87 |
| Debt-to-Assets | 0.30 | 0.29 | 0.33 |
| Debt-to-Capital | 0.42 | 0.43 | 0.46 |
| Net Debt to EBITDA | 2.67 | 2.54 | 2.33 |
| Current Ratio | 1.67 | 1.62 | 1.59 |
| Quick Ratio | 1.05 | 1.07 | 1.04 |
| Financial Leverage | 2.47 | 2.60 | 2.62 |
Corning's balance sheet remains robust, supported by a prudent debt structure and liquidity management, ensuring financial resilience and flexibility.
Fundamental Strength & Profitability 💪
Examining fundamental strength and profitability reveals Corning's healthy margins and competitive returns on equity and assets, crucial for funding ongoing dividends and enhancing shareholder value.
| Metric | 2023 | 2024 | 2025 |
|---|---|---|---|
| Return on Equity | 5.03% | 4.74% | 13.52% |
| Return on Assets | 2.04% | 1.82% | 5.15% |
| Net Margin | 4.62% | 3.86% | 10.21% |
| EBIT Margin | 9.10% | 8.71% | 15.28% |
| EBITDA Margin | 19.97% | 18.99% | 23.90% |
| Gross Margin | 31.23% | 32.60% | 35.28% |
| R&D to Revenue | 8.55% | 8.30% | 7.10% |
Corning's profitability metrics display its efficient capitalization on resources, providing robust cash flows to support dividend policies and strategic ventures.
Price Development 📉
Dividend Scoring System 🗣️
| Criteria | Score (1-5) | Rating |
|---|---|---|
| Dividend yield | 3 | |
| Dividend Stability | 4 | |
| Dividend growth | 3 | |
| Payout ratio | 4 | |
| Financial stability | 4 | |
| Dividend continuity | 5 | |
| Cashflow Coverage | 3 | |
| Balance Sheet Quality | 4 |
Total Score: 30/40
Rating 🏆
Corning Incorporated's dividend profile combines stability with potential for growth, making it an attractive choice for long-term, income-focused investors. The company's solid financial foundation and commitment to shareholder returns provide confidence in sustained dividend payments. However, the moderate growth rate and yield might not cater to high-yield seekers. Overall, Corning earns a strong investment rating for those valuing resilience and consistent returns in a technology sector leader.
Smart Data Insight
Master the Perfect Entry & Exit for this Stock
Don't leave your profits to chance. Historically, this stock follows specific seasonal patterns that institutional traders use to maximize returns.
- ✅ Identify the "Golden Buying Window"
- ✅ Avoid high-risk correction cycles
- ✅ Backtested data from the last 20+ years