January 19, 2026 a 07:31 am
GLW: Dividend Analysis - Corning Incorporated
Corning Incorporated has demonstrated consistent dividend performance, with 39 consecutive years of dividend history. Despite a relatively modest dividend yield of 1.36%, the company has maintained a reasonable growth rate over the past five years. The last cut occurred in 2007, reflecting a longstanding commitment to returning value to shareholders.
📊 Overview
Corning has consistently operated in the technology and manufacturing sectors, exhibiting financial resilience and operational efficiency. Its commitment to dividend stability is reflected in longstanding dividend history.
| Sector | Dividend Yield (%) | Current Dividend per Share (USD) | Dividend History (Years) | Last Cut or Suspension |
|---|---|---|---|---|
| Technology, Manufacturing | 1.36% | 1.16 USD | 39 | 2007 |
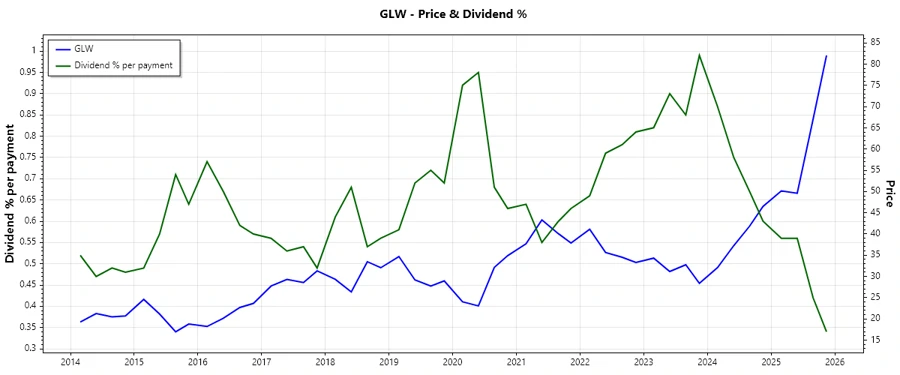
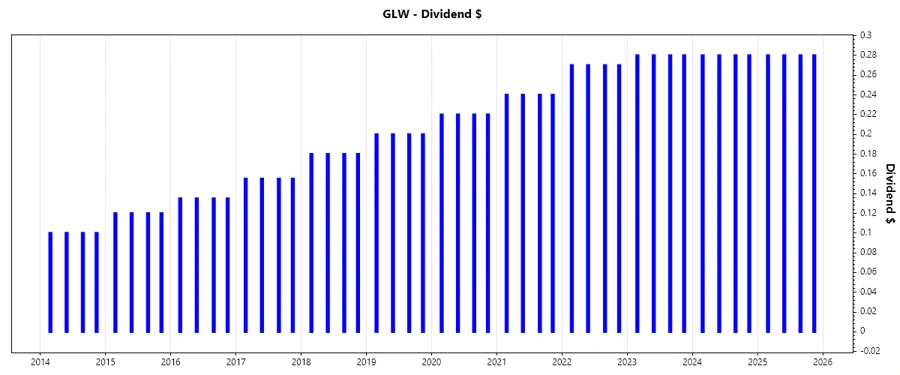
🗣️ Dividend History
The dividend history of Corning underscores its commitment to shareholders. This long-term track record offers investors a sense of stability and reliability, crucial for assessing ongoing income potential.
| Year | Dividend per Share (USD) |
|---|---|
| 2025 | 1.12 |
| 2024 | 1.12 |
| 2023 | 1.12 |
| 2022 | 1.08 |
| 2021 | 0.96 |
📈 Dividend Growth
Dividend growth is an important measure of financial health and shareholder value. Corning's growth rates over 3 and 5 years indicate a moderate upward trend, essential for income-seeking investors.
| Time | Growth (%) |
|---|---|
| 3 years | 1.22% |
| 5 years | 4.94% |
The average dividend growth is 4.94% over 5 years. This shows moderate but steady dividend growth.
✅ Payout Ratio
Payout ratios provide insight into how sustainable a company's dividend payments are relative to its earnings and cash flow. Corning's ratios reflect a balanced approach to distribution and reinvestment.
| Key Figure | Ratio |
|---|---|
| EPS-based | 72.77% |
| Free Cash Flow-based | 85.29% |
The EPS payout ratio at 72.77% and FCF payout ratio at 85.29% suggest a commendable balance between paying dividends and retaining earnings for growth.
Cashflow & Capital Efficiency
Understanding the efficiency of capital utilization and cash flow generation is crucial. Corning's metrics offer a glimpse into its financial agility and capital efficiency.
| Year | 2024 | 2023 | 2022 |
|---|---|---|---|
| Free Cash Flow Yield | 2.40% | 2.38% | 3.75% |
| Earnings Yield | 1.25% | 2.25% | 4.89% |
| CAPEX to Operating Cash Flow | 49.77% | 69.33% | 61.34% |
| Stock-based Compensation to Revenue | 2.08% | 1.73% | 1.23% |
| Free Cash Flow / Operating Cash Flow Ratio | 50.23% | 30.67% | 38.66% |
Corning's cash flow and capital metrics indicate a balance between reinvestment and maintaining operational liquidity, essential for sustained business growth.
Balance Sheet & Leverage Analysis
The leverage ratios provide insights into the company's debt levels and its capacity to meet financial obligations. Corning's ratios demonstrate manageable leverage, promoting financial soundness.
| Year | 2024 | 2023 | 2022 |
|---|---|---|---|
| Debt-to-Equity | 0.76 | 0.73 | 0.65 |
| Debt-to-Assets | 0.29 | 0.30 | 0.26 |
| Debt-to-Capital | 0.43 | 0.42 | 0.39 |
| Net Debt to EBITDA | 2.54 | 2.67 | 1.74 |
| Current Ratio | 1.62 | 1.67 | 1.44 |
| Quick Ratio | 1.07 | 1.05 | 0.88 |
| Financial Leverage | 2.60 | 2.47 | 2.46 |
Corning's leverage ratios suggest a balanced debt structure, with adequate liquidity to cover short-term liabilities, showcasing strong financial health.
Fundamental Strength & Profitability
Profitability and sustained business strength are reflected in these fundamental ratios, signaling operational effectiveness and efficiency.
| Year | 2024 | 2023 | 2022 |
|---|---|---|---|
| Return on Equity | 4.74% | 5.03% | 10.96% |
| Return on Assets | 1.82% | 2.04% | 4.46% |
| Net Margin | 3.86% | 4.62% | 9.27% |
| EBIT Margin | 8.71% | 9.10% | 14.72% |
| EBITDA Margin | 18.99% | 19.97% | 24.96% |
| Gross Margin | 32.60% | 31.23% | 31.76% |
| Research & Development to Revenue | 8.30% | 8.55% | 7.38% |
Corning showcases competent performance with stable margins and returns, indicating robust operational capabilities and market competitiveness.
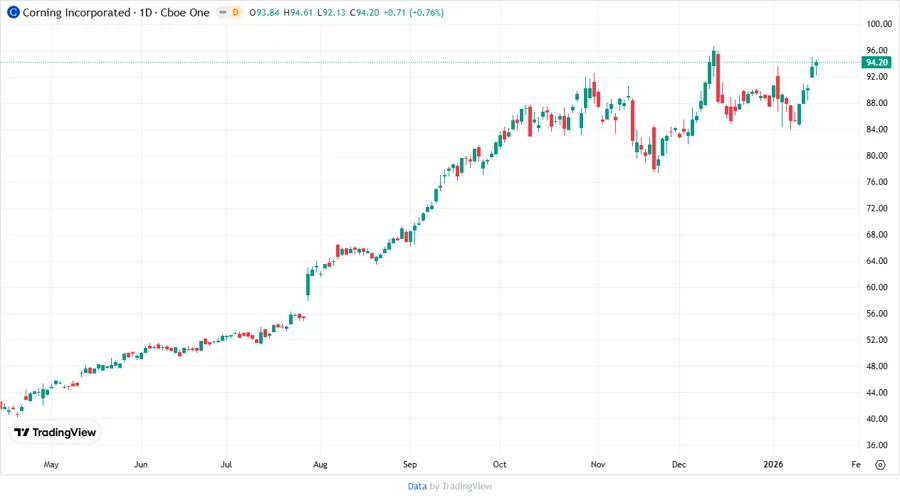
Price Development
📉 Dividend Scoring System
| Criteria | Score | Score Bar |
|---|---|---|
| Dividend yield | 3 | |
| Dividend Stability | 5 | |
| Dividend growth | 4 | |
| Payout ratio | 4 | |
| Financial stability | 4 | |
| Dividend continuity | 5 | |
| Cashflow Coverage | 4 | |
| Balance Sheet Quality | 4 |
Overall Score: 33/40
⚠️ Rating
Corning Incorporated presents a strong, reliable dividend profile, suitable for investors seeking steady growth and income. Although the dividend yield is moderate, the company's commitment to sustainable growth and prudent financial management makes it an appealing long-term investment.