October 31, 2025 a 04:03 am

GIS: Trend and Support & Resistance Analysis - General Mills, Inc.
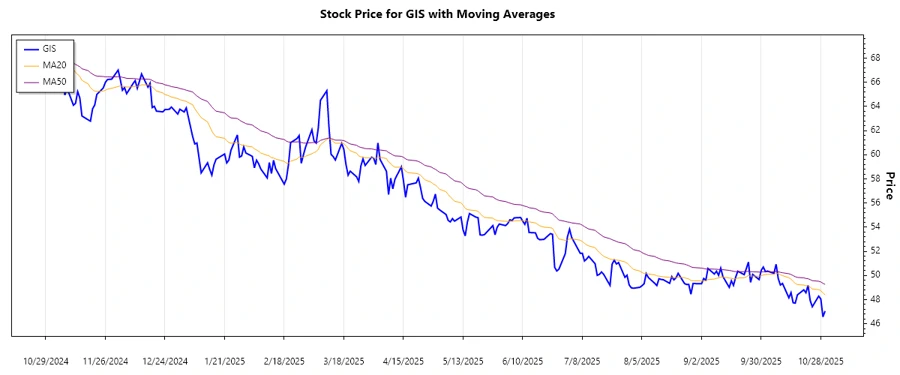
General Mills, Inc. has shown a bearish trend recently with a consistent decline in stock prices. The notable decrease in EMA values signals potential investor caution. Support and resistance levels are crucial to observe as they may determine future price movements.
Trend Analysis
The recent market trend for General Mills, Inc. (GIS) shows a bearish disposition. The EMA20 is consistently below the EMA50, indicative of a downward trend.
| Date | Closing Price | Trend |
|---|---|---|
| 2025-10-30 | $47.05 | ▼ Down |
| 2025-10-29 | $46.57 | ▼ Down |
| 2025-10-28 | $48.05 | ▼ Down |
| 2025-10-27 | $48.29 | ▼ Down |
| 2025-10-24 | $47.41 | ▼ Down |
| 2025-10-23 | $47.93 | ▼ Down |
| 2025-10-22 | $49.18 | ▼ Down |
The consistent downward trend indicates selling pressure, suggesting investors are cautious about the current market conditions.
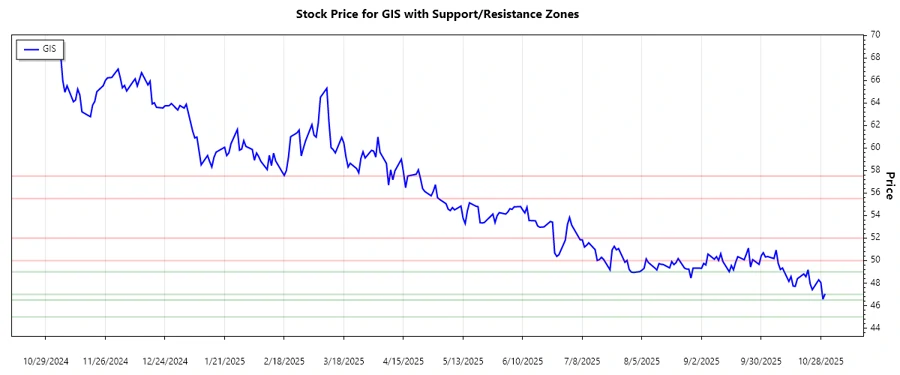
Support and Resistance
After analyzing the closing prices, we identify the following support and resistance zones.
| Zone | From | To |
|---|---|---|
| Resistance 1 | 50.00 | 52.00 |
| Resistance 2 | 55.50 | 57.50 |
| Support 1 | 47.00 | 49.00 |
| Support 2 | 45.00 | 46.50 |
The current price is approaching the first support zone, which could provide a temporary halt to the bear trend. Monitoring this level is crucial for potential reversals or further decline.
Conclusion
General Mills, Inc. (GIS) presents a bearish outlook based on recent technical indicators. The declining trend, with EMA20 below EMA50, suggests mounting selling pressure. Key support levels could offer opportunities for stabilization or bearish continuation. Caution is advised for potential investors as support zones are tested; however, these zones may also serve as potential entry points, depending on market response. Continuous monitoring of support and resistance levels will provide valuable insight into future trend direction.
Smart Data Insight
Master the Perfect Entry & Exit for this Stock
Don't leave your profits to chance. Historically, this stock follows specific seasonal patterns that institutional traders use to maximize returns.
- ✅ Identify the "Golden Buying Window"
- ✅ Avoid high-risk correction cycles
- ✅ Backtested data from the last 20+ years