
July 24, 2026 a 06:00 pm
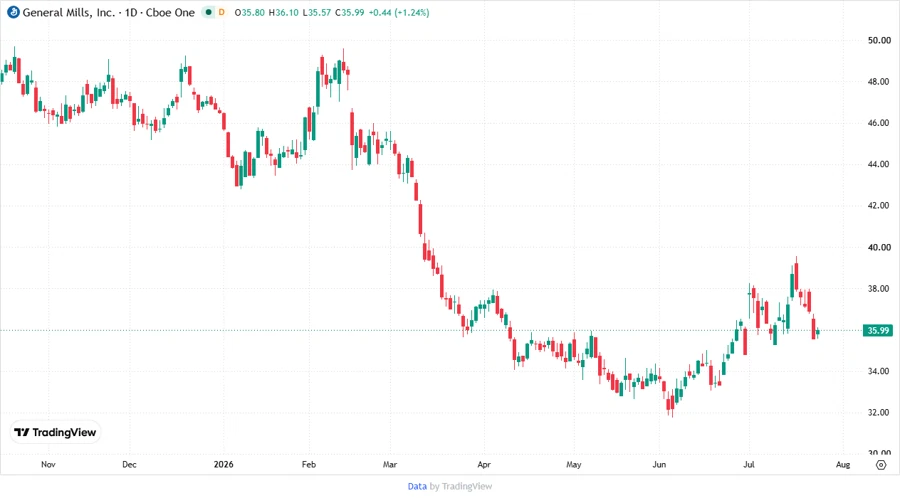
GIS: Fundamental Ratio Analysis - General Mills, Inc.
General Mills, Inc. is a diversified food company with a steady business model. The company’s approach of focusing on consumer preferences and its massive distribution network offers long-term stability. However, certain financial metrics may not initially point towards strong growth potential.
Fundamental Rating
The fundamental analysis of General Mills reveals moderate scores, emphasizing a need for cautious investment strategies despite a consistent product portfolio.
| Category | Score | Visualization |
|---|---|---|
| Discounted Cash Flow | 5 | |
| Return on Equity | 1 | |
| Return on Assets | 1 | |
| Debt to Equity | 1 | |
| Price to Earnings | 1 | |
| Price to Book | 2 |
Historical Rating
Recent historical financial performance suggests some areas of concern, with past scores reflecting initial investment apprehension.
| Date | Overall Score | DCF | ROE | ROA | D/E | P/E | P/B |
|---|---|---|---|---|---|---|---|
| 07/23/2026 | 2 | 5 | 1 | 1 | 1 | 1 | 2 |
| N/A | 0 | 5 | 1 | 1 | 1 | 1 | 2 |
Analyst Price Targets
The price target assessment indicates a mixed sentiment among analysts, suggesting stable yet unspectacular prospective movement.
| High | Low | Median | Consensus |
|---|---|---|---|
| 47 | 31 | 36 | 36.92 |
Analyst Sentiment
Analyst recommendations indicate a tendency toward holding the stock, with a moderate blend of buy and sell recommendations.
| Recommendation | Count | Visualization |
|---|---|---|
| Strong Buy | 0 | |
| Buy | 8 | |
| Hold | 22 | |
| Sell | 6 | |
| Strong Sell | 0 |
Conclusion
General Mills, Inc. exhibits characteristics of a steady and defensive equity asset, with a vast product range aiding in market resilience. Despite lower growth metrics, the company's operational breadth and diverse product offerings provide stability. However, the current financials suggest a measured approach to investment, with potential risks associated with slow growth and high debt ratios. As such, it suits investors focusing on steady income over dynamic growth.
Smart Data Insight
Master the Perfect Entry & Exit for this Stock
Don't leave your profits to chance. Historically, this stock follows specific seasonal patterns that institutional traders use to maximize returns.
- ✅ Identify the "Golden Buying Window"
- ✅ Avoid high-risk correction cycles
- ✅ Backtested data from the last 20+ years