August 02, 2025 a 03:31 pm


GIS: Dividend Analysis - General Mills, Inc.
📊 General Mills, Inc. offers a compelling dividend profile with a robust history and moderate growth prospects. As a staple in the consumer sector, this company attracts income-focused investors with its reliable dividend payouts. Despite a decreasing dividend yield due to market value changes, the company's historical consistency in dividends underscores its commitment to shareholder returns.
Overview
🗣️ General Mills is prominent in the Food Products sector, known for its strong dividend history and investor appeal.
| Metric | Data |
|---|---|
| Sector | Food Products |
| Dividend yield | 4.69% |
| Current dividend per share | 2.41 USD |
| Dividend history | 43 years |
| Last cut or suspension | None |
Dividend History
📉 The company's impressive 43-year dividend history highlights consistent payouts and stability, crucial for income investors.
| Year | Dividend per Share (USD) |
|---|---|
| 2025 | 1.81 |
| 2024 | 2.38 |
| 2023 | 2.26 |
| 2022 | 2.10 |
| 2021 | 2.04 |
Dividend Growth
📈 Despite modest growth rates, General Mills shows resilience in enhancing shareholder value through dividends.
| Time | Growth |
|---|---|
| 3 years | 5.27% |
| 5 years | 3.96% |
✅ The average dividend growth is 3.96% over 5 years. This shows moderate but steady dividend growth.
Payout Ratio
⚠️ Analyzing payout ratios is vital to assess dividend sustainability.
| Key Figure | Ratio |
|---|---|
| EPS-based | 65.85% |
| Free cash flow-based | 57.11% |
The EPS payout ratio of 65.85% indicates a significant portion of earnings is distributed as dividends, yet remaining within a safe range. The FCF payout ratio of 57.11% suggests reasonable dividend safety based on cash flows.
Cashflow & Capital Efficiency
💼 Evaluating cashflow efficiency is essential for assessing the company's ability to fund dividends and operations.
| Metric | 2025 | 2024 | 2023 |
|---|---|---|---|
| Free Cash Flow Yield | 9.86% | 6.43% | 4.17% |
| Earnings Yield | 7.72% | 6.35% | 5.18% |
| CAPEX to Operating Cash Flow | 0% | 23.44% | 24.81% |
| Stock-based Compensation to Revenue | 0.47% | 0.48% | 0.56% |
| Free Cash Flow / Operating Cash Flow Ratio | 1 | 0.77 | 0.75 |
🔍 The cash flow metrics suggest stability with decent capital efficiency ratios, indicating solid cash flow viability for dividends.
Balance Sheet & Leverage Analysis
📓 Understanding leverage ratios helps gauge financial risk and stability.
| Metric | 2025 | 2024 | 2023 |
|---|---|---|---|
| Debt-to-Equity | 161.74% | 141.70% | 115.46% |
| Debt-to-Assets | 44.99% | 42.31% | 38.36% |
| Debt-to-Capital | 61.79% | 58.63% | 53.59% |
| Net Debt to EBITDA | 3.72 | 3.16 | 2.81 |
| Current Ratio | 0.67 | 0.66 | 0.69 |
| Quick Ratio | 0.43 | 0.38 | 0.40 |
| Financial Leverage | 3.59 | 3.35 | 3.01 |
The leverage ratios imply a high level of debt but a manageable risk profile. The financial stability remains satisfactory given the interest coverage capability.
Fundamental Strength & Profitability
🧮 Key profitability metrics indicate internal wealth generation capabilities.
| Metric | 2025 | 2024 | 2023 |
|---|---|---|---|
| Return on Equity | 24.84% | 26.57% | 24.82% |
| Return on Assets | 6.91% | 7.93% | 8.25% |
| Net Margin | 11.72% | 12.57% | 12.91% |
| EBIT Margin | 17.24% | 17.76% | 17.60% |
| EBITDA Margin | 20.00% | 20.54% | 20.32% |
| Gross Margin | 34.52% | 34.91% | 32.58% |
| R&D to Revenue | 0% | 0% | 0% |
The profitability metrics demonstrate efficient asset utilization and stable margin performances, suggesting strong competitive positioning and operational excellence.
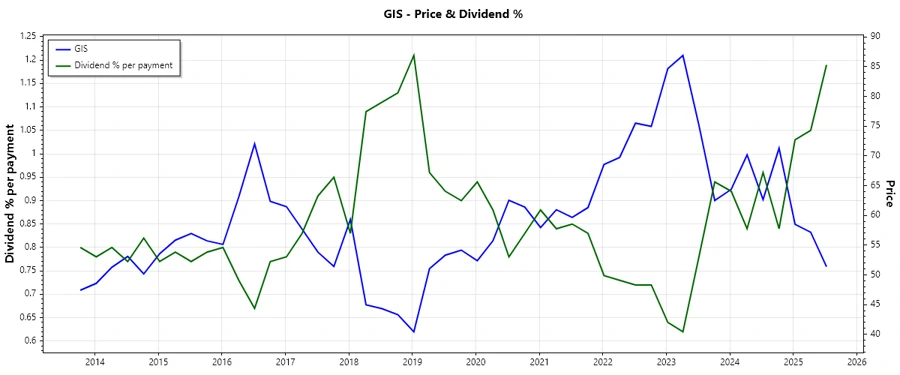
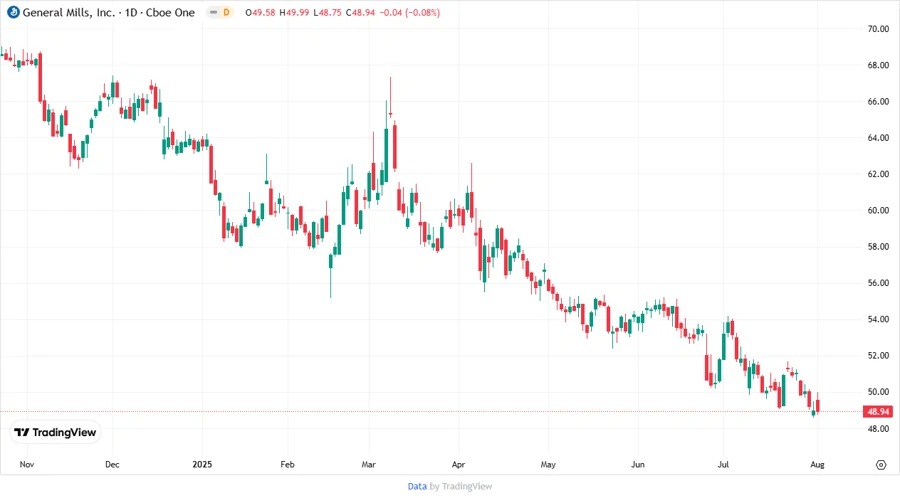
Price Development
Dividend Scoring System
| Criteria | Score | Representation |
|---|---|---|
| Dividend yield | 4/5 | |
| Dividend Stability | 5/5 | |
| Dividend growth | 3/5 | |
| Payout ratio | 4/5 | |
| Financial stability | 3/5 | |
| Dividend continuity | 5/5 | |
| Cashflow Coverage | 4/5 | |
| Balance Sheet Quality | 3/5 |
Total Score: 31/40
Rating
🔑 General Mills, Inc. presents a reliable long-term investment potential for dividend investors. The consistent dividend history, coupled with moderate growth and diligent management of payout ratios, support a Buy recommendation for income-focused investors seeking steady cash flows coupled with systematic risk management.
Smart Data Insight
Master the Perfect Entry & Exit for this Stock
Don't leave your profits to chance. Historically, this stock follows specific seasonal patterns that institutional traders use to maximize returns.
- ✅ Identify the "Golden Buying Window"
- ✅ Avoid high-risk correction cycles
- ✅ Backtested data from the last 20+ years