June 24, 2025 a 07:31 am

GIS: Dividend Analysis - General Mills, Inc.
General Mills, Inc., a stalwart in the consumer goods sector, boasts a robust dividend history with 43 consecutive years of dividend payments. Its current dividend yield of 4.20% is attractive for income-focused investors. However, its growth rate has been modest, reflecting the company's focus on stability. This analysis aims to illuminate the strengths and potential vulnerabilities of its dividend profile.
📊 Overview
General Mills operates within the Consumer Goods sector, a reliable industry with consistent demand. The company's dividend yield of 4.20% provides a compelling allure for dividend seekers. Maintaining a history of 43 years without a suspension indicates a commendable commitment to shareholders.
| Metric | Detail |
|---|---|
| Sector | Consumer Goods |
| Dividend yield | 4.20% |
| Current dividend per share | 2.37 USD |
| Dividend history | 43 years |
| Last cut or suspension | None |
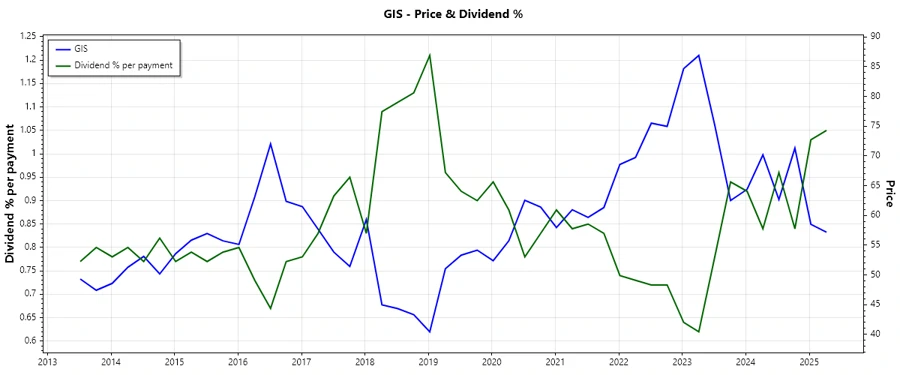
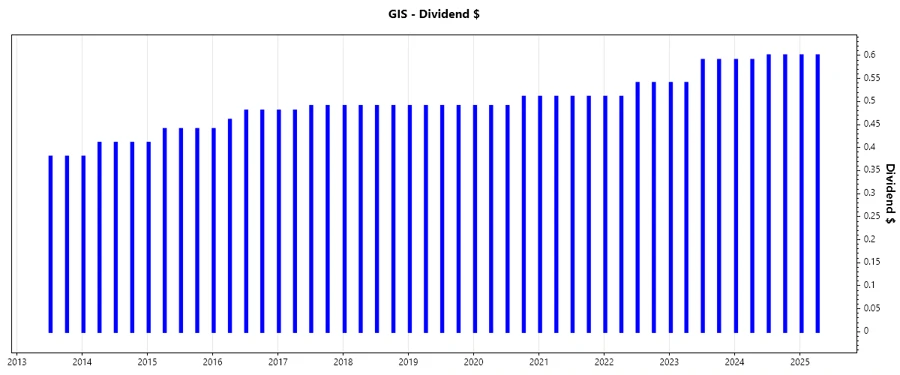
🗣️ Dividend History
Analyzing dividend history provides insights into the company's commitment to returning profits to shareholders. Consistent dividend payments, especially in challenging economic conditions, pinpoint financial resilience.
The chart above visualizes payments over recent years, demonstrating consistency and a clear upward trajectory.
| Year | Dividend per Share (USD) |
|---|---|
| 2025 | 1.2 |
| 2024 | 2.38 |
| 2023 | 2.26 |
| 2022 | 2.10 |
| 2021 | 2.04 |
📈 Dividend Growth
Tracking dividend growth highlights a company's ability to increase shareholder returns over time. This growth is vital for combating inflation and enhancing total returns.
| Time | Growth |
|---|---|
| 3 years | 5.27% |
| 5 years | 3.96% |
The average dividend growth is 3.96% over 5 years, indicating moderate but steady growth, reflecting responsible management underpinned by realistic financial policies.
💼 Payout Ratio
Payout ratios furnish insights into the sustainability of dividends. Utilizing both EPS and FCF-based ratios ensures a comprehensive view of dividend coverage.
| Payout Ratio | Percentage |
|---|---|
| EPS-based | 51.16% |
| Free cash flow-based | 52.38% |
With an EPS payout ratio of 51.16% and a FCF payout ratio of 52.38%, the dividends appear adequately covered by the company's earnings and cash flows.
📊 Cashflow & Capital Efficiency
Evaluating cash flow metrics and capital allocation effectiveness reveals the company's ability to generate and utilize cash prudently, impacting dividend sustainability.
| Year | 2024 | 2023 | 2022 |
|---|---|---|---|
| Free Cash Flow Yield | 6.43% | 4.17% | 6.47% |
| Earnings Yield | 6.35% | 5.18% | 6.38% |
| CAPEX to Operating Cash Flow | 23.44% | 24.81% | 17.15% |
| Stock-based Compensation to Revenue | 0.48% | 0.56% | 0.52% |
| Free Cash Flow / Operating Cash Flow Ratio | 76.56% | 75.19% | 82.85% |
The robust free cash flow yield indicates sufficient cash generation, supporting dividend obligations and strategic investments while maintaining low capital consumption.
📉 Balance Sheet & Leverage Analysis
Balance sheet stability is critical for assessing financial health. A strong balance sheet safeguards against economic downturns and facilitates sustainable dividend payments.
| Year | 2024 | 2023 | 2022 |
|---|---|---|---|
| Debt-to-Equity | 1.42 | 1.15 | 1.14 |
| Debt-to-Assets | 0.42 | 0.38 | 0.39 |
| Debt-to-Capital | 0.59 | 0.54 | 0.53 |
| Net Debt to EBITDA | 3.42 | 2.81 | 2.74 |
| Current Ratio | 0.67 | 0.69 | 0.63 |
| Quick Ratio | 0.38 | 0.40 | 0.40 |
| Financial Leverage | 3.35 | 3.01 | 2.95 |
The leverage indicators suggest a moderate but manageable debt level given General Mills' cash flow and earnings capacity.
🔍 Fundamental Strength & Profitability
Fundamental metrics, including profitability ratios, convey the company's operational efficiency and the effectiveness of its cost management strategies.
| Year | 2024 | 2023 | 2022 |
|---|---|---|---|
| Return on Equity | 26.57% | 24.82% | 25.68% |
| Return on Assets | 7.93% | 8.25% | 8.71% |
| Margins: Net | 12.57% | 12.91% | 14.25% |
| Margins: EBIT | 17.76% | 17.60% | 18.92% |
| Research & Development to Revenue | 0% | 0% | 0% |
The profitability metrics indicate robust operational performance with consistent returns on equity and assets, reinforcing General Mills' viability as an investment.
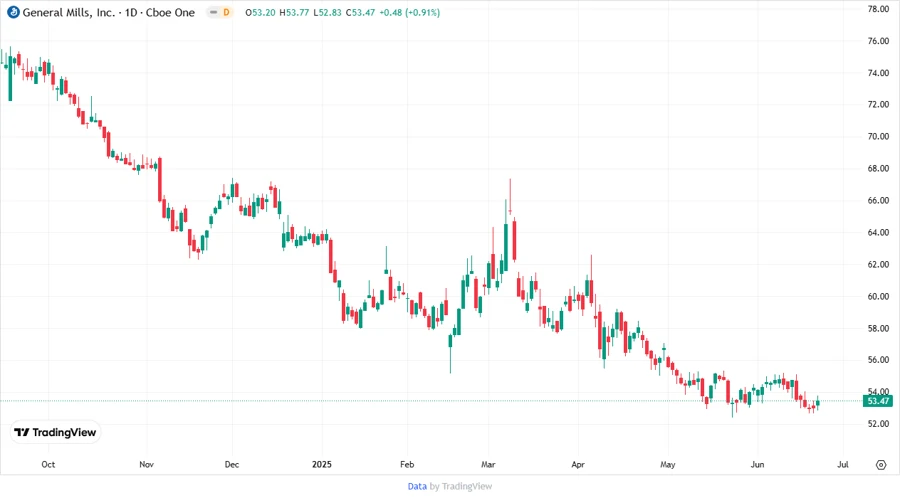
⚠️ Price Development
📊 Dividend Scoring System
| Category | Score | |
|---|---|---|
| Dividend yield | 4 | |
| Dividend Stability | 5 | |
| Dividend growth | 3 | |
| Payout ratio | 4 | |
| Financial stability | 4 | |
| Dividend continuity | 5 | |
| Cashflow Coverage | 4 | |
| Balance Sheet Quality | 4 |
Overall Score: 33/40
✅ Rating
General Mills, Inc. presents itself as a reliable dividend payer with a solid history and sustainable payout ratios. While dividend growth remains modest, the company offers attractive yields and a strong commitment to shareholders. Continued observation on financial stability and market dynamics is recommended for investors focused on income and long-term growth.
Smart Data Insight
Master the Perfect Entry & Exit for this Stock
Don't leave your profits to chance. Historically, this stock follows specific seasonal patterns that institutional traders use to maximize returns.
- ✅ Identify the "Golden Buying Window"
- ✅ Avoid high-risk correction cycles
- ✅ Backtested data from the last 20+ years