September 20, 2025 a 11:31 am

GILD: Dividend Analysis - Gilead Sciences, Inc.
Gilead Sciences, Inc., a prominent player in the biotechnology sector, shows a stable dividend history with a current dividend yield of 2.79%. This analysis delves into the various aspects of its dividend performance, growth prospects, payout sustainability, and overall financial health. The consistent dividend payments over the past 11 years highlight the company's commitment to returning value to its shareholders.
Overview 📊
Gilead Sciences, Inc. operates within the biotechnology sector, offering investors a dividend yield of 2.79% with a current dividend per share at 3.14 USD. The company has sustained its dividend payments for 11 years, with no recent cuts or suspensions—an indication of strong financial health.
| Metric | Value |
|---|---|
| Sector | Biotechnology |
| Dividend Yield | 2.79% |
| Current Dividend per Share | 3.14 USD |
| Dividend History | 11 years |
| Last Cut or Suspension | None |
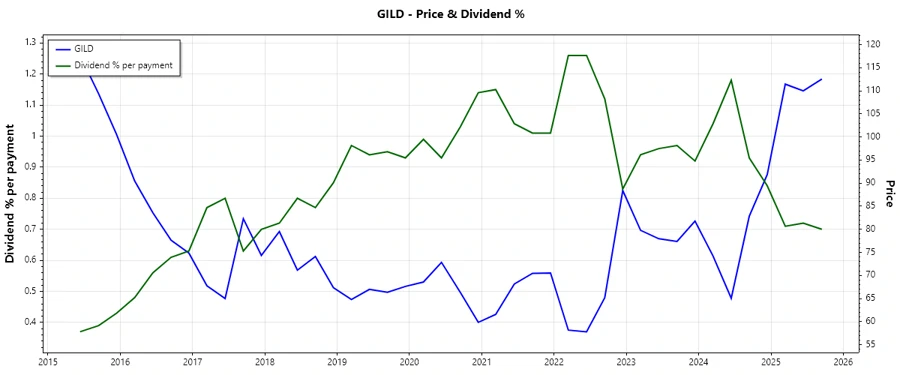
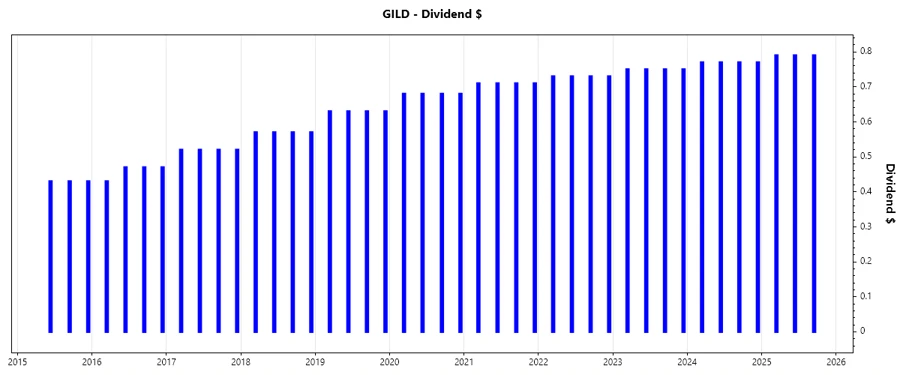
Dividend History 📈
The dividend history of Gilead Sciences reveals consistent growth, which is crucial as it reflects the company's ability to generate cash and satisfy shareholder returns year after year.
| Year | Dividend per Share (USD) |
|---|---|
| 2025 | 2.37 |
| 2024 | 3.08 |
| 2023 | 3.00 |
| 2022 | 2.92 |
| 2021 | 2.84 |
Dividend Growth 📈
Dividend growth is a vital indicator of a company's future prospects and financial health. With a growth rate of 2.74% over the last three years and 4.1% over the last five years, Gilead Sciences demonstrates moderate but steady dividend growth, highlighting its robust cash flow capabilities.
| Time | Growth |
|---|---|
| 3 years | 2.74% |
| 5 years | 4.10% |
The average dividend growth is 4.1% over 5 years, which shows moderate but steady dividend growth.
Payout Ratio 🗣️
The payout ratio provides insight into the sustainability of the dividend. Gilead Sciences' EPS-based payout ratio stands at 62%, with a free cash flow-based payout ratio at 42%. These figures suggest a balanced approach to maintaining shareholder payouts while reinvesting in growth opportunities.
| Key figure | Ratio |
|---|---|
| EPS-based | 62% |
| Free cash flow-based | 42% |
With an EPS payout ratio of 62% and FCF payout ratio of 42%, Gilead maintains a sustainable balance between dividends and growth investment.
Cashflow & Capital Efficiency ✅
Analyzing cash flow and capital efficiency is crucial for understanding a company’s operational health and investment effectiveness. The metrics demonstrate a solid earnings yield and efficient use of capital expenditure.
| Year | 2024 | 2023 | 2022 |
|---|---|---|---|
| Free Cash Flow Yield | 8.95% | 7.34% | 7.74% |
| Earnings Yield | 0.42% | 5.60% | 4.26% |
| CAPEX to Operating Cash Flow | 5.05% | 7.31% | 8.02% |
| Stock-based Compensation to Revenue | 3.02% | 2.82% | 2.36% |
| Free Cash Flow / Operating Cash Flow Ratio | 95.17% | 92.69% | 91.97% |
The steady cash flow ratios align with Gilead’s growth trajectory, underpinning its ability to manage capital efficiently and sustain operations.
Balance Sheet & Leverage Analysis ⚠️
Understanding a company's leverage and financial stability is essential for evaluating its risk. Gilead Sciences' leverage ratios are within acceptable limits, suggesting prudent fiscal management.
| Year | 2024 | 2023 | 2022 |
|---|---|---|---|
| Debt-to-Equity | 1.38 | 1.09 | 1.19 |
| Debt-to-Assets | 0.45 | 0.40 | 0.40 |
| Debt-to-Capital | 0.58 | 0.52 | 0.54 |
| Net Debt to EBITDA | 3.77 | 1.80 | 2.24 |
These ratios suggest Gilead's strong balance sheet position, with controls in place to maintain leverage at reasonable levels for business expansion.
Fundamental Strength & Profitability 📈
Profitability ratios like ROE and margins reflect the company's efficiency in using resources to generate earnings. Gilead shows impressive profitability metrics, paving the way for continued growth.
| Year | 2024 | 2023 | 2022 |
|---|---|---|---|
| Return on Equity | 2.48% | 24.81% | 21.61% |
| Return on Assets | 0.81% | 9.12% | 7.27% |
| Net Profit Margin | 1.67% | 20.89% | 16.83% |
| Gross Margin | 78.26% | 76.04% | 79.26% |
| Research & Development to Revenue | 20.46% | 21.08% | 18.24% |
These robust profitability metrics underscore Gilead's ability to sustainably grow revenues and manage expenses effectively.
Dividend Scoring System ✅
| Category | Score | Rating |
|---|---|---|
| Dividend yield | 3 | |
| Dividend Stability | 4 | |
| Dividend Growth | 3 | |
| Payout Ratio | 4 | |
| Financial Stability | 4 | |
| Dividend Continuity | 5 | |
| Cashflow Coverage | 4 | |
| Balance Sheet Quality | 4 |
Total Score: 31/40
Rating ⚠️
Gilead Sciences, Inc. is a fundamentally robust company with a strong track record of dividend payouts and sustainable growth. The stable dividend yield, combined with consistent dividend increases, bolsters investor confidence. The financial and operational metrics underscore a well-managed company that is poised for future growth. Overall, Gilead Sciences represents a strong dividend play with moderate growth expectations.
Smart Data Insight
Master the Perfect Entry & Exit for this Stock
Don't leave your profits to chance. Historically, this stock follows specific seasonal patterns that institutional traders use to maximize returns.
- ✅ Identify the "Golden Buying Window"
- ✅ Avoid high-risk correction cycles
- ✅ Backtested data from the last 20+ years