July 23, 2025 a 11:31 am


GILD: Dividend Analysis - Gilead Sciences, Inc.
Gilead Sciences, Inc. presents a compelling opportunity for income-focused investors with its solid dividend profile. Despite a modest yield, the company's commitment to consistent dividend distributions is evident from its 11-year history without cuts. Furthermore, its strategic financial management underpins future dividend sustainability, making GILD a reliable component for a diversified portfolio.
📊 Overview
GILD stands in the biopharmaceutical sector, known for intensive R&D and critical innovation. With a current dividend yield of 2.84%, Gilead offers investors a stable income stream backed by a steady dividend per share of $3.14 and an unbroken dividend payment history spanning 11 years.
| Metric | Value |
|---|---|
| Sector | Biopharmaceutical |
| Dividend Yield | 2.84% |
| Current Dividend per Share | 3.14 USD |
| Dividend History | 11 years |
| Last Cut or Suspension | None |
🗣️ Dividend History
The dividend history of Gilead Sciences reflects its long-standing commitment to shareholder returns. Monitoring dividend trends is critical to assess the firm's ability to sustain payouts even in adverse market conditions.
| Year | Dividend per Share (USD) |
|---|---|
| 2025 | 1.58 |
| 2024 | 3.08 |
| 2023 | 3.00 |
| 2022 | 2.92 |
| 2021 | 2.84 |
📈 Dividend Growth
Analyzing dividend growth provides insights into a company's potential for future payouts. Sustainable dividend growth indicates effective revenue utilization and aligns with increasing shareholder wealth.
| Time | Growth |
|---|---|
| 3 years | 2.74% |
| 5 years | 4.10% |
The average dividend growth is 4.10% over 5 years. This shows moderate but steady dividend growth.
✅ Payout Ratio
The payout ratio reflects how much of its earnings Gilead returns to shareholders as dividends. A balanced payout ratio indicates the company's capability to continue paying dividends without jeopardizing growth.
| Key Figure | Ratio |
|---|---|
| EPS-based | 65.63% |
| Free Cash Flow-based | 39.70% |
The EPS payout ratio of 65.63% alongside a 39.70% free cash flow payout ratio suggests a sustainable dividend policy, balancing shareholder return and business reinvestment.
💸 Cashflow & Capital Efficiency
Gilead's cash flow metrics are indicative of its operational health and capital allocation efficiency. These metrics ensure strategic growth funding and dividend coverage.
| Metric | 2022 | 2023 | 2024 |
|---|---|---|---|
| Free Cash Flow Yield | 7.74% | 7.34% | 8.95% |
| Earnings Yield | 4.26% | 5.60% | 0.42% |
| CAPEX to Operating Cash Flow | 8.02% | 7.31% | 4.83% |
| Stock-based Compensation to Revenue | 2.36% | 2.82% | 2.90% |
| Free Cash Flow / Operating Cash Flow Ratio | 91.98% | 92.69% | 95.17% |
The robust cash flow and capital efficiency metrics underscore Gilead's ability to fund dividends and growth initiatives without compromising financial stability.
📉 Balance Sheet & Leverage Analysis
Analyzing leverage and balance sheet metrics provides insight into Gilead’s financial health, ability to manage debt, and maintain liquidity.
| Metric | 2022 | 2023 | 2024 |
|---|---|---|---|
| Debt-to-Equity | 118.78% | 109.43% | 138.18% |
| Debt-to-Assets | 39.94% | 40.22% | 45.28% |
| Debt-to-Capital | 54.29% | 52.25% | 58.02% |
| Net Debt to EBITDA | 2.24x | 1.80x | 3.77x |
| Current Ratio | 1.29 | 1.43 | 1.60 |
| Quick Ratio | 1.15 | 1.27 | 1.45 |
| Financial Leverage | 2.97x | 2.72x | 3.05x |
These ratios reflect Gilead’s effective debt management and solid liquidity, ensuring the capability to meet financial obligations and support growth initiatives.
🧮 Fundamental Strength & Profitability
Fundamentals reveal the intrinsic performance and profitabilitypotential, indicating sustainable growth and investor confidence.
| Metric | 2022 | 2023 | 2024 |
|---|---|---|---|
| Return on Equity | 21.62% | 24.81% | 2.48% |
| Return on Assets | 7.27% | 9.12% | 0.81% |
| Net Margin | 16.83% | 20.89% | 1.67% |
| EBIT Margin | 24.74% | 28.78% | 5.80% |
| EBITDA Margin | 32.45% | 38.71% | 15.42% |
| Gross Margin | 79.26% | 76.04% | 78.26% |
| Research & Development to Revenue | 18.24% | 21.09% | 20.54% |
These profitability metrics show Gilead’s robust financial performance and efficiency in asset utilization, which contribute to its growth and competitive edge.
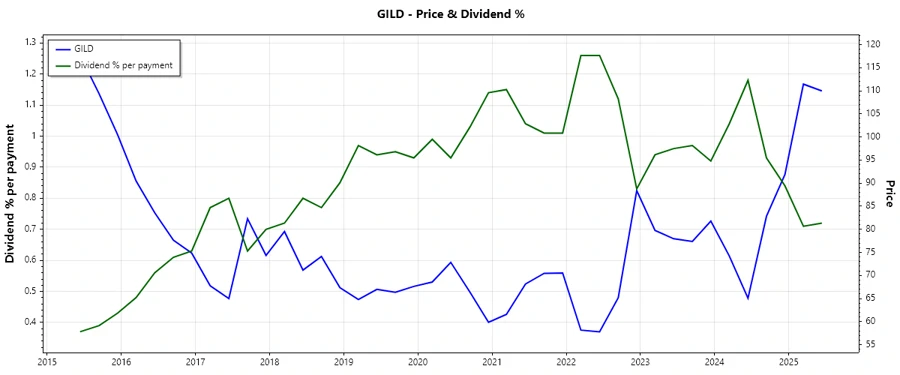
📊 Price Development
🏆 Dividend Scoring System
| Category | Score | Graph |
|---|---|---|
| Dividend Yield | 4 | |
| Dividend Stability | 5 | |
| Dividend Growth | 3 | |
| Payout Ratio | 4 | |
| Financial Stability | 4 | |
| Dividend Continuity | 5 | |
| Cashflow Coverage | 5 | |
| Balance Sheet Quality | 4 |
Total Score: 34/40
🌟 Rating
Gilead Sciences, Inc. earns a strong dividend stock rating, offering reliability through its consistent dividend history, stable payout ratios, and formidable financial foundation. Suitable for conservative investors seeking both income and potential growth, Gilead represents a compelling addition to a balanced portfolio.
Smart Data Insight
Master the Perfect Entry & Exit for this Stock
Don't leave your profits to chance. Historically, this stock follows specific seasonal patterns that institutional traders use to maximize returns.
- ✅ Identify the "Golden Buying Window"
- ✅ Avoid high-risk correction cycles
- ✅ Backtested data from the last 20+ years