September 12, 2025 a 09:03 am
GE: Trend and Support & Resistance Analysis - GE Aerospace
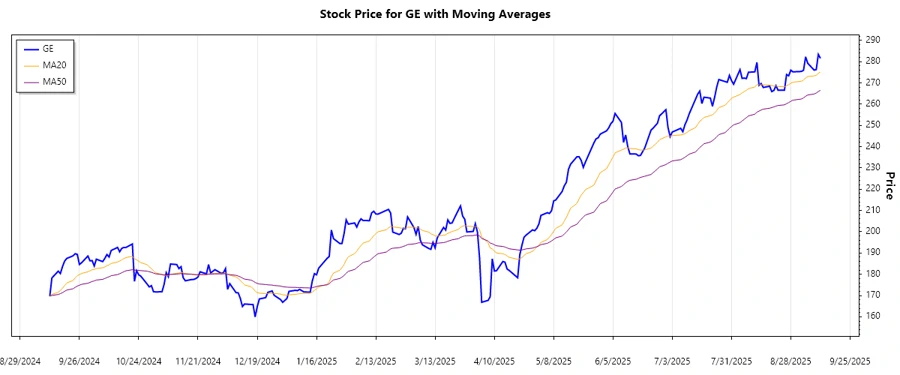
GE Aerospace has shown significant price actions over the past few months, reflecting its engagement in diverse aerospace sectors. The technical indicators, such as the EMA20 and EMA50, suggest how the stock is currently trending within the market. Additionally, support and resistance levels provide crucial insights into potential future price movements. Investors should stay aware of these zones to make informed decisions.
Trend Analysis
The price data for GE Aerospace over the past few months indicates a dynamic trend. Based on the exponential moving averages, we have calculated the EMA20 and EMA50 to assess the current trend direction. Here's a summary of the analysis:
| Date | Closing Price | Trend |
|---|---|---|
| 2025-09-11 | 281.56 | ▲ Uptrend |
| 2025-09-10 | 283.41 | ▲ Uptrend |
| 2025-09-09 | 276.24 | ⚖️ Neutral |
| 2025-09-08 | 276.05 | ⚖️ Neutral |
| 2025-09-05 | 279.23 | ▲ Uptrend |
| 2025-09-04 | 282.27 | ▲ Uptrend |
| 2025-09-03 | 275.93 | ⚖️ Neutral |
The recent uptrend is underscored by the EMA20 crossing above the EMA50, signaling strong bullish momentum. This is supportive of continued upward movement in the stock price.
Support and Resistance
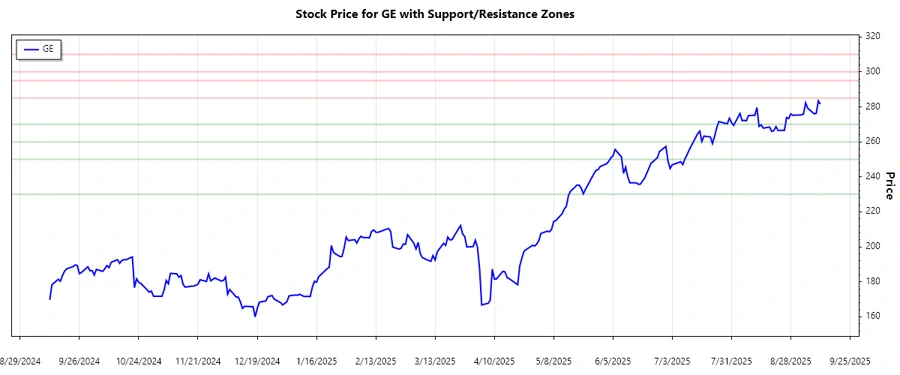
Based on technical analysis, the following support and resistance zones have been identified:
| Zone | From | To |
|---|---|---|
| Support Zone 1 | 230.00 | 250.00 |
| Support Zone 2 | 260.00 | 270.00 |
| Resistance Zone 1 | 285.00 | 295.00 |
| Resistance Zone 2 | 300.00 | 310.00 |
The current trading price is approaching a major resistance zone, which if breached, could lead to a significant uptrend. Investors should monitor these levels closely.
Conclusion
GE Aerospace has exhibited strong performance, with current trends suggesting potential for further upward movement. However, resistance levels must be watched to confirm any breakout. The balance between opportunities in aerospace sectors and market challenges will dictate future price actions. Overall, careful monitoring and strategic investment decisions are advised, especially near key support and resistance levels.
Smart Data Insight
Master the Perfect Entry & Exit for this Stock
Don't leave your profits to chance. Historically, this stock follows specific seasonal patterns that institutional traders use to maximize returns.
- ✅ Identify the "Golden Buying Window"
- ✅ Avoid high-risk correction cycles
- ✅ Backtested data from the last 20+ years