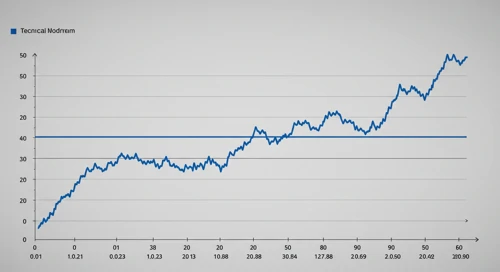
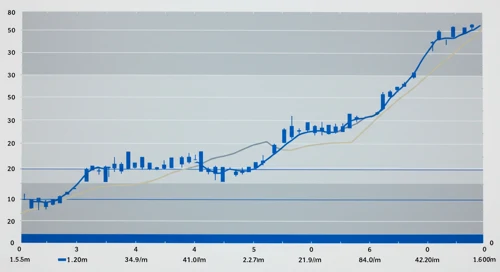
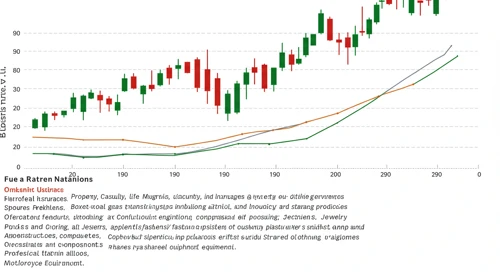
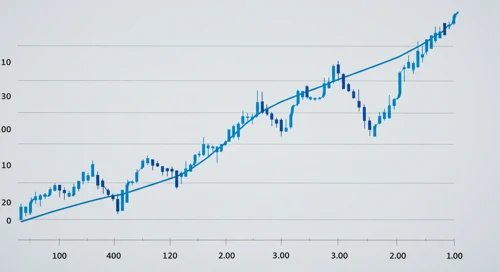
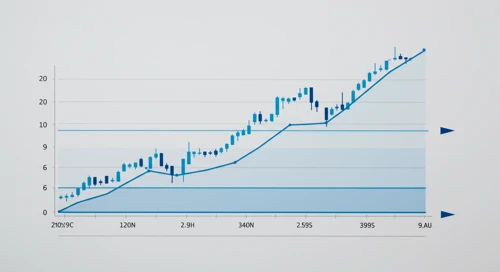
BLDR: Trend with Support and Resistance Levels - Builders FirstSource Inc

BLDR: Current price trend is evaluated alongside key support and resistance level. View of potential turning points and price momentum.
April 20, 2026 a 02:03 pm
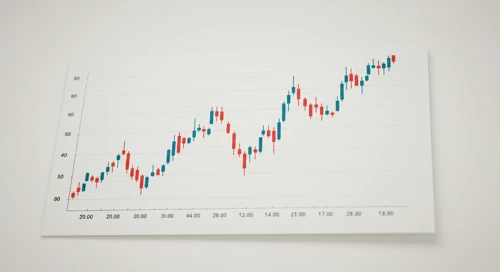
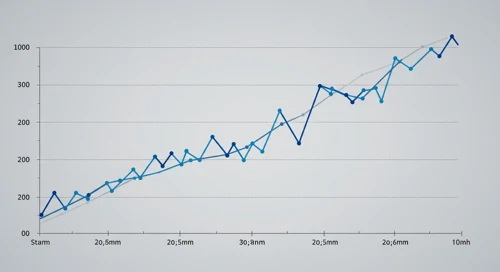
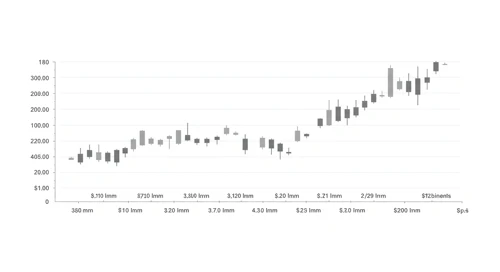
NFLX: Trend with Support and Resistance Levels - Netflix Inc

NFLX: Current price trend is evaluated alongside key support and resistance level. View of potential turning points and price momentum.
April 20, 2026 a 01:15 pm
GEHC: Analysts Ratings - GE HealthCare Technologies Inc
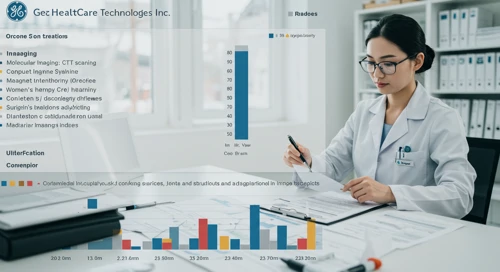
GEHC: Comprehensive breakdown of current and historical analyst ratings, offering insights into how expert sentiment has evolved over time.
April 20, 2026 a 01:01 pm
ROK: Fundamental Ratio Analysis - Rockwell Automation Inc

ROK: Evaluation of key financial ratios, analyst ratings, and price targets. A data-driven perspective on the valuation and market expectations.
April 20, 2026 a 01:00 pm
TKO: Analysts Ratings - TKO Group Holdings Inc

TKO: Comprehensive breakdown of current and historical analyst ratings, offering insights into how expert sentiment has evolved over time.
April 20, 2026 a 12:38 pm
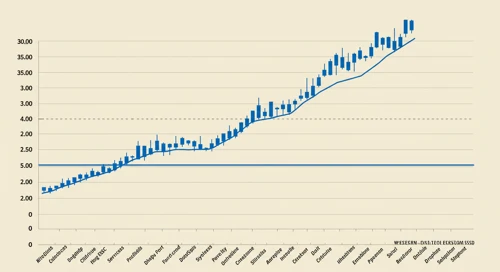
America Comparison. 20 Apr
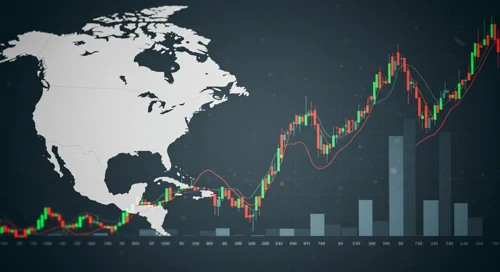
Comparison of America. Where is strength and weakness? What has developed well and badly?
April 20, 2026 a 12:31 pm
LOW: Fibunacci Level Technical Analysis - Lowes Companies Inc
LOW: Fibonacci retracement levels to identify key potential support and resistance zones, based on recent price trends.
April 20, 2026 a 11:44 am

ZBRA: Fundamental Ratio Analysis - Zebra Technologies Corporation
April 20, 2026 a 03:43 pm

KHC: Fibunacci Level Technical Analysis - The Kraft Heinz Company
April 20, 2026 a 03:15 pm

Currencies Comparison. 20 Apr
April 20, 2026 a 03:07 pm
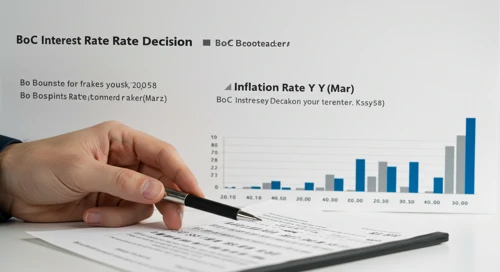
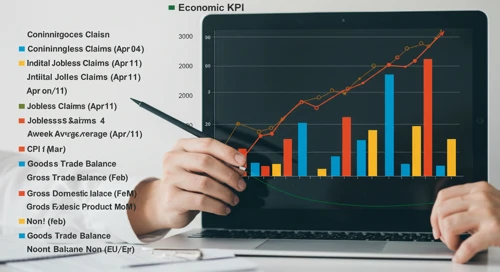
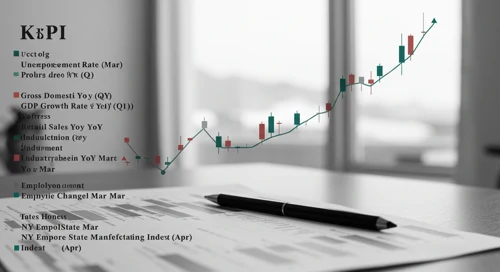
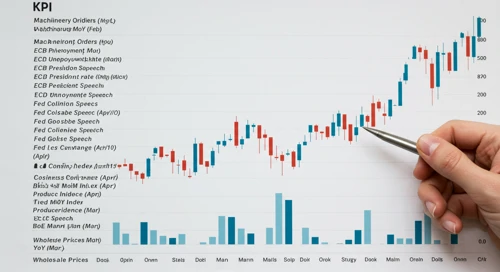
Todays Important Key Figures 20 Apr
April 20, 2026 a 03:00 pm
AIG: Fundamental Ratio Analysis - American International Group Inc

AIG: Evaluation of key financial ratios, analyst ratings, and price targets. A data-driven perspective on the valuation and market expectations.
April 20, 2026 a 11:43 am
ELV: Dividend Analysis - Elevance Health Inc

ELV: In-depth analysis of a company's dividend stability and key fundamental ratios to assess its financial strength and long-term investment potential.
April 20, 2026 a 11:31 am
WMT: Fibunacci Level Technical Analysis - Walmart Inc
WMT: Fibonacci retracement levels to identify key potential support and resistance zones, based on recent price trends.
April 20, 2026 a 10:15 am
Materials Comparison. 20 Apr
Comparison of Materials. Where is strength and weakness? What has developed well and badly?
April 20, 2026 a 09:16 am
BALL: Trend with Support and Resistance Levels - Ball Corporation
BALL: Current price trend is evaluated alongside key support and resistance level. View of potential turning points and price momentum.
April 20, 2026 a 09:03 am
TYL: Analysts Ratings - Tyler Technologies Inc
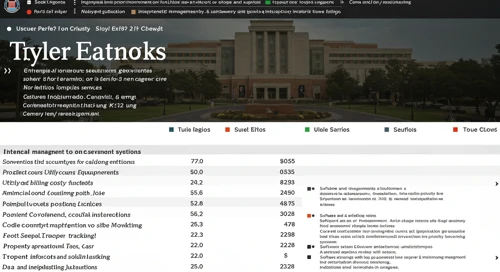
TYL: Comprehensive breakdown of current and historical analyst ratings, offering insights into how expert sentiment has evolved over time.
April 20, 2026 a 09:00 am
LNT: Analysts Ratings - Alliant Energy Corporation
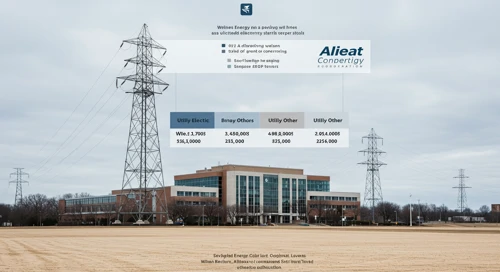
LNT: Comprehensive breakdown of current and historical analyst ratings, offering insights into how expert sentiment has evolved over time.
April 20, 2026 a 08:38 am
Stock Market - Heatmap
Use mouse wheel to zoom in and out. Click a ticker to display detailed information in a new window. Hover mouse cursor over a ticker to see more data.
Stock's
NUE: Dividend Analysis - Nucor Corporation
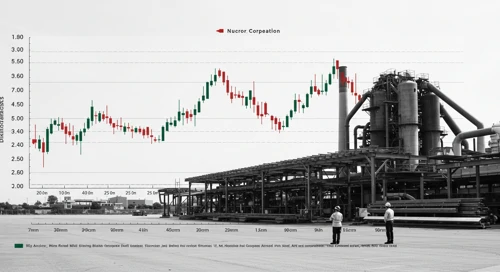
NUE: In-depth analysis of a company's dividend stability and key fundamental ratios to assess its financial strength and long-term investment potential.
April 20, 2026 a 07:31 am
KR: Fibunacci Level Technical Analysis - The Kroger Co
KR: Fibonacci retracement levels to identify key potential support and resistance zones, based on recent price trends.
April 20, 2026 a 06:44 am
PM: Fibunacci Level Technical Analysis - Philip Morris International Inc
PM: Fibonacci retracement levels to identify key potential support and resistance zones, based on recent price trends.
April 20, 2026 a 05:15 am
SATS: Trend with Support and Resistance Levels - EchoStar Corporation
SATS: Current price trend is evaluated alongside key support and resistance level. View of potential turning points and price momentum.
April 20, 2026 a 04:03 am
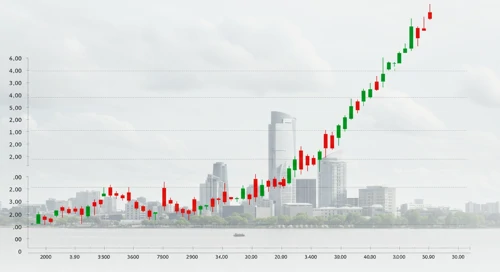
XOM: Trend with Support and Resistance Levels - Exxon Mobil Corporation
XOM: Current price trend is evaluated alongside key support and resistance level. View of potential turning points and price momentum.
April 20, 2026 a 03:15 am
CVS: Dividend Analysis - CVS Health Corporation
CVS: In-depth analysis of a company's dividend stability and key fundamental ratios to assess its financial strength and long-term investment potential.
April 20, 2026 a 02:46 am
EXR: Analysts Ratings - Extra Space Storage Inc
EXR: Comprehensive breakdown of current and historical analyst ratings, offering insights into how expert sentiment has evolved over time.
April 19, 2026 a 09:00 pm
WDC: Trend with Support and Resistance Levels - Western Digital Corporation
April 20, 2026 a 08:15 am
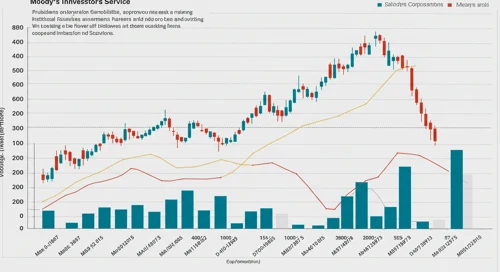
MCO: Fundamental Ratio Analysis - Moodys Corporation
April 20, 2026 a 08:00 am

NTRS: Dividend Analysis - Northern Trust Corporation
April 20, 2026 a 07:46 am
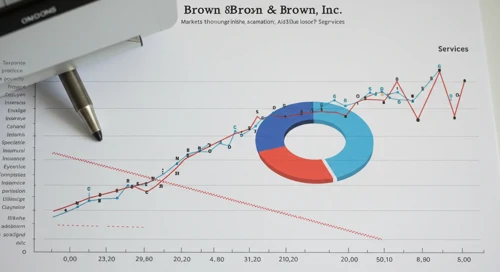
BRO: Fundamental Ratio Analysis - Brown and Brown Inc
April 20, 2026 a 07:43 am
ALLE: Analysts Ratings - Allegion plc

ALLE: Comprehensive breakdown of current and historical analyst ratings, offering insights into how expert sentiment has evolved over time.
April 19, 2026 a 08:38 pm
IT: Fundamental Ratio Analysis - Gartner Inc

IT: Evaluation of key financial ratios, analyst ratings, and price targets. A data-driven perspective on the valuation and market expectations.
April 19, 2026 a 07:43 pm
ES: Fundamental Ratio Analysis - Eversource Energy
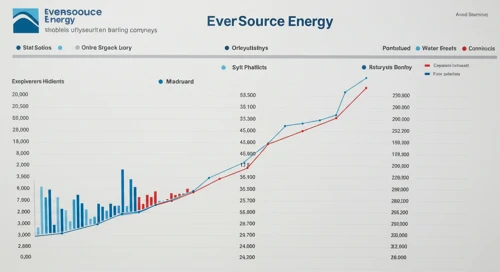
ES: Evaluation of key financial ratios, analyst ratings, and price targets. A data-driven perspective on the valuation and market expectations.
April 19, 2026 a 06:00 pm
BRK B: Analysts Ratings - Berkshire Hathaway Inc
BRK-B: Comprehensive breakdown of current and historical analyst ratings, offering insights into how expert sentiment has evolved over time.
April 19, 2026 a 05:00 pm
HPE: Fibunacci Level Technical Analysis - Hewlett Packard Enterprise Company
HPE: Fibonacci retracement levels to identify key potential support and resistance zones, based on recent price trends.
April 19, 2026 a 04:44 pm
WELL: Analysts Ratings - Welltower Inc
WELL: Comprehensive breakdown of current and historical analyst ratings, offering insights into how expert sentiment has evolved over time.
April 19, 2026 a 04:38 pm
ADI: Fundamental Ratio Analysis - Analog Devices Inc
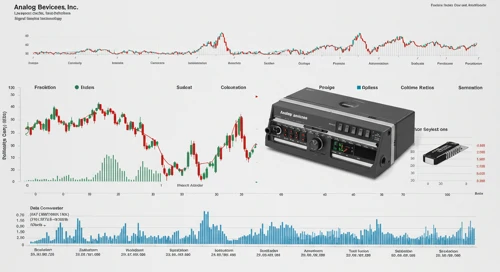
ADI: Evaluation of key financial ratios, analyst ratings, and price targets. A data-driven perspective on the valuation and market expectations.
April 19, 2026 a 03:43 pm
Economic Calendar
Currencies
EURAUD: Fibunacci Level Technical Analysis
EURAUD: Fibonacci retracement levels to identify key potential support and resistance zones, based on recent price trends.
April 18, 2026 a 05:08 am
CADCHF: Trend with Support and Resistance Levels

CADCHF: Current price trend is evaluated alongside key support and resistance level. View of potential turning points and price momentum.
April 18, 2026 a 04:28 am
Todays Important Key Figures 18 Apr

Today’s important economic data releases – a snapshot of key indicators influencing markets and shaping financial expectations.
April 17, 2026 a 11:00 pm
Todays Important Key Figures 17 Apr
Today’s important economic data releases – a snapshot of key indicators influencing markets and shaping financial expectations.
April 17, 2026 a 07:00 pm
NZDCAD: Fibunacci Level Technical Analysis
NZDCAD: Fibonacci retracement levels to identify key potential support and resistance zones, based on recent price trends.
April 17, 2026 a 05:08 am
EURGBP: Trend with Support and Resistance Levels
EURGBP: Current price trend is evaluated alongside key support and resistance level. View of potential turning points and price momentum.
April 17, 2026 a 04:28 am
Todays Important Key Figures 16 Apr
Today’s important economic data releases – a snapshot of key indicators influencing markets and shaping financial expectations.
April 16, 2026 a 07:00 pm
USDCHF: Fibunacci Level Technical Analysis
April 20, 2026 a 05:08 am
USDCAD: Trend with Support and Resistance Levels
April 20, 2026 a 04:28 am

NZDJPY: Fibunacci Level Technical Analysis
April 19, 2026 a 05:08 am
EURCHF: Trend with Support and Resistance Levels
April 19, 2026 a 04:28 am
CHFJPY: Fibunacci Level Technical Analysis
CHFJPY: Fibonacci retracement levels to identify key potential support and resistance zones, based on recent price trends.
April 16, 2026 a 05:08 am
Important Key Figures of the last Days
Overview of key economic indicators released over the past days, highlighting their potential impact on markets and investor sentiment.
April 16, 2026 a 02:31 am
Todays Important Key Figures 15 Apr
Today’s important economic data releases – a snapshot of key indicators influencing markets and shaping financial expectations.
April 15, 2026 a 07:00 pm
EURNZD: Fibunacci Level Technical Analysis

EURNZD: Fibonacci retracement levels to identify key potential support and resistance zones, based on recent price trends.
April 15, 2026 a 05:08 am
AUDNZD: Trend with Support and Resistance Levels

AUDNZD: Current price trend is evaluated alongside key support and resistance level. View of potential turning points and price momentum.
April 15, 2026 a 04:28 am
Todays Important Key Figures 14 Apr
Today’s important economic data releases – a snapshot of key indicators influencing markets and shaping financial expectations.
April 14, 2026 a 07:00 pm
GBPSEK: Fibunacci Level Technical Analysis
GBPSEK: Fibonacci retracement levels to identify key potential support and resistance zones, based on recent price trends.
April 14, 2026 a 05:08 am
Currencies