November 27, 2025 a 03:15 pm

GE: Fibonacci Analysis - GE Aerospace
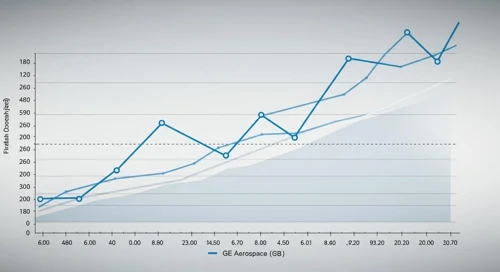
GE Aerospace has shown an impressive performance with a consistent uptrend over recent months, matched by solid growth in its commercial and defense sectors. The company's innovation in jet and turboprop engines as well as its diverse portfolio of brands have positioned it well for sustained growth. However, the broader market sentiment and potential fluctuations in global demand for aerospace technologies could introduce some volatility.
Fibonacci Analysis
| Detail | Value |
|---|---|
| Start Date | 2024-11-27 |
| End Date | 2025-11-26 |
| High Price | 311.94 (2025-11-10) |
| Low Price | 159.95 (2024-12-18) |
| 23.6% Fibonacci Level | 200.39 |
| 38.2% Fibonacci Level | 226.95 |
| 50% Fibonacci Level | 235.95 |
| 61.8% Fibonacci Level | 251.51 |
| 78.6% Fibonacci Level | 270.72 |
The current price is within the 61.8% Fibonacci retracement level, indicating potential support at this level.
Technically, this suggests the possibility of rebound or consolidation, implying investor confidence in this price range.
Conclusion
GE Aerospace's consistent uptrend highlights its strong market position and innovative prowess in the aerospace industry. With significant advancements and expansions, the company appears well poised for long-term growth. Yet, potential risks include global economic fluctuations and changes in defense budgets affecting the demand for GE's aerospace solutions. Analysts should pay close attention to the technical support levels, particularly the current 61.8% retracement zone, as a possible indicator of investor sentiment and potential bullish resurgence. Overall, GE Aerospace remains a compelling option for investors seeking exposure to the aerospace and defense sectors.