
July 02, 2026 a 11:31 am

GE: Dividend Analysis - GE Aerospace
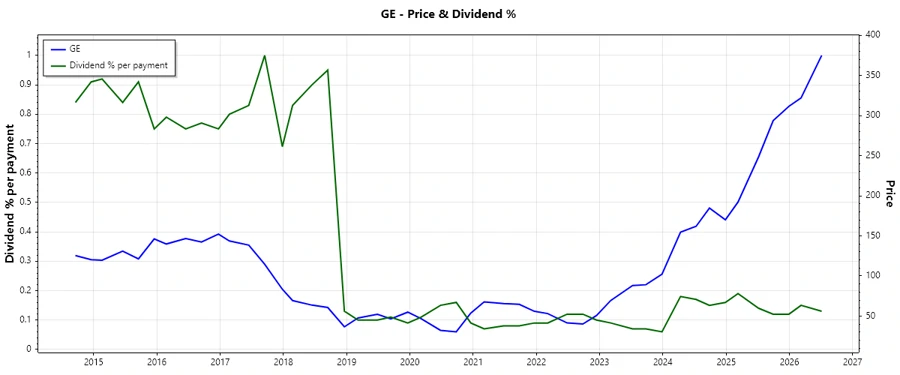
GE Aerospace has demonstrated resilience through its consistent dividend history, positioning itself as a potential mainstay for dividend-focused investors. With almost four decades of unbroken dividend payouts and a moderated yield, the company stands as a stable choice in aerospace. Its prudent financial strategy reflects in robust payout ratios and low leverage, indicating sustainable dividends in the long term. 📈 Despite a relatively low dividend yield, the company's strategic positioning and financial management ensure continued growth and stability.
📊 Overview
GE Aerospace serves in the industrial sector, offering a modest dividend yield at 0.44% with a current dividend per share of 1.36 USD. The firm boasts a sturdy dividend history of 38 years, reflecting its commitment to shareholder returns. Notably, there have been no recent cuts or suspensions, signaling steady and reliable dividend distributions.
| Metric | Details |
|---|---|
| Sector | Industrial |
| Dividend yield | 0.44% |
| Current dividend per share | 1.36 USD |
| Dividend history | 38 years |
| Last cut or suspension | None |
📉 Dividend History
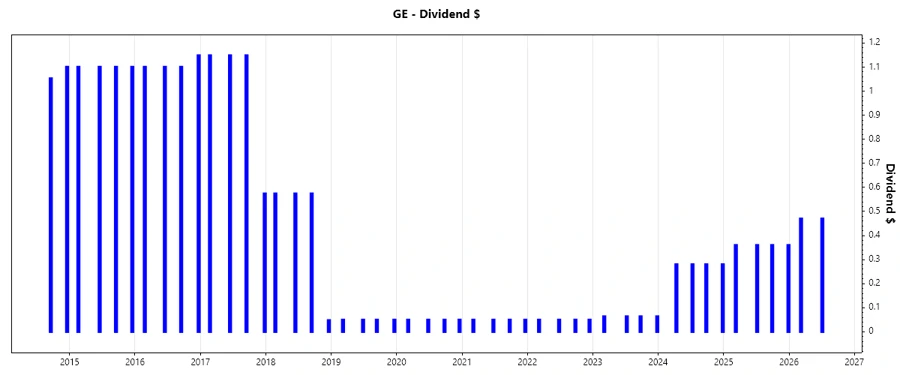
A strong dividend history is crucial for assessing a company's commitment to returning value to shareholders. GE Aerospace's history enhances its appeal, ensuring investors of its financial health and commitment to reliable returns. The absence of recent cuts also underscores its fiscal responsibility.
| Year | Dividend per Share (USD) |
|---|---|
| 2026 | 0.94 |
| 2025 | 1.44 |
| 2024 | 1.12 |
| 2023 | 0.26 |
| 2022 | 0.20 |
📈 Dividend Growth
The company's dividend growth over the recent years suggests a calculated approach towards enhancing shareholder value. Monitoring the growth rate over separate time frames can offer insights into future dividend prospects and company performance.
| Time | Growth |
|---|---|
| 3 years | 0.93% |
| 5 years | 0.49% |
The average dividend growth is 0.49% over 5 years. This shows moderate but steady dividend growth.
✅ Payout Ratio
Payout ratios serve as indicators of how sustainable a company’s dividend payment is relative to its earnings and cash flow. GE Aerospace's EPS-based payout ratio of 16.31% and FCF-based payout ratio of 19.07% reflect a conservative approach, providing a strong safety margin for maintaining dividend distributions even in adverse economic scenarios.
| Key figure | Ratio |
|---|---|
| EPS-based | 16.31% |
| Free cash flow-based | 19.07% |
These figures highlight GE Aerospace's disciplined dividend policy, ensuring both flexibility and sustainability.
🗣️ Cashflow & Capital Efficiency
Assessing cash flows and capital efficiency aids in understanding a company's operational effectiveness and its ability to generate cash. This ensures that dividend payments are well-supported by operational and free cash flow.
| Metric | 2023 | 2024 | 2025 |
|---|---|---|---|
| Free Cash Flow Yield | 3.23% | 2.03% | 2.21% |
| Earnings Yield | 8.55% | 3.62% | 2.65% |
| CAPEX to Operating Cash Flow | 30.80% | 21.91% | 14.91% |
| Stock-based Compensation to Revenue | 1.02% | 0.09% | 0.00% |
| Free Cash Flow / Operating Cash Flow Ratio | 69.20% | 78.09% | 85.08% |
The analysis of cash flow metrics shows robust efficiency, implying that GE Aerospace is proficient in managing its resources and operations for shareholder returns.
💰 Balance Sheet & Leverage Analysis
The company’s balance sheet and leverage ratios help in determining financial stability and risk. These metrics ensure that the firm is not overly reliant on debt, maintaining liquidity to meet short-term obligations.
| Metric | 2023 | 2024 | 2025 |
|---|---|---|---|
| Debt-to-Equity | 0.79 | 1.05 | 1.10 |
| Debt-to-Assets | 0.12 | 0.16 | 0.16 |
| Debt-to-Capital | 0.44 | 0.51 | 0.52 |
| Net Debt to EBITDA | 0.52 | 0.69 | 0.67 |
| Current Ratio | 1.33 | 1.09 | 1.04 |
| Quick Ratio | 1.07 | 0.81 | 0.74 |
| Financial Leverage | 6.43 | 6.50 | 6.97 |
GE Aerospace retains a solid capital structure, prudently managing its leverages to support its operational and strategic needs.
📌 Fundamental Strength & Profitability
Fundamental analysis on profitability metrics, such as returns on equity and assets or profit margins, highlights a company's operational efficiency and ability to convert sales into actual profit. GE Aerospace shows a promising profile, indicating both strength and potential for long-term growth.
| Metric | 2023 | 2024 | 2025 |
|---|---|---|---|
| Return on Equity | 34.60% | 33.90% | 46.60% |
| Return on Assets | 5.38% | 5.21% | 6.69% |
| Net Margin | 26.82% | 16.94% | 18.98% |
| EBIT Margin | 32.45% | 22.24% | 23.65% |
| EBITDA Margin | 35.78% | 25.30% | 26.31% |
| Gross Margin | 35.11% | 37.19% | 36.83% |
| R&D to Revenue | 2.86% | 3.32% | 3.45% |
Overall, GE Aerospace illustrates strong profitability and innovation, fostering confidence about its competitive standing and future prospects.
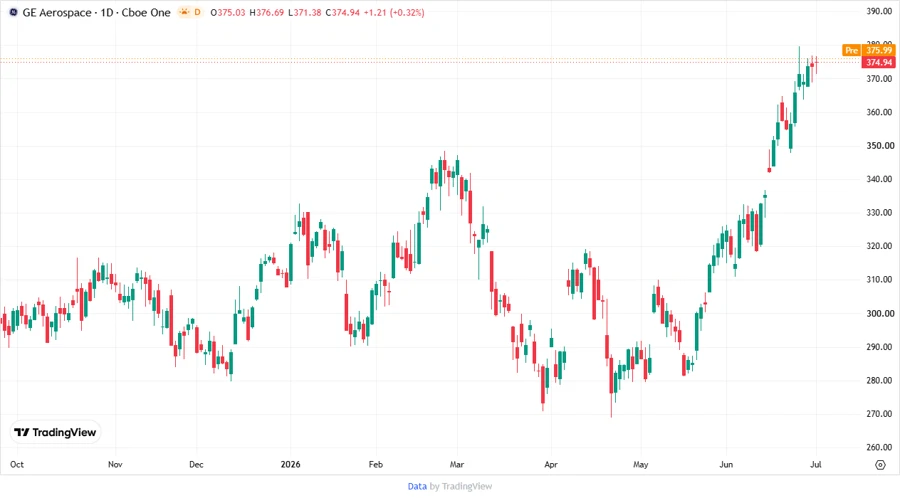
🌟 Price Development
🎯 Dividend Scoring System
| Category | Score | Score Bar |
|---|---|---|
| Dividend yield | 2/5 | |
| Dividend Stability | 5/5 | |
| Dividend growth | 3/5 | |
| Payout ratio | 4/5 | |
| Financial stability | 4/5 | |
| Dividend continuity | 5/5 | |
| Cashflow Coverage | 4/5 | |
| Balance Sheet Quality | 4/5 |
Total Score: 31/40
📌 Rating
GE Aerospace scores as a solid choice for dividend investors looking for stability and enduring returns, backed by its consistent dividend payouts and strong balance sheet. While the dividend yield may not be high, the company's growth prospects and financial strategies provide optimism, making it an attractive option for a diversified, income-focused portfolio. The recommendation is to "buy" for long-term income investors focused on stability and future capital appreciation opportunities.✅
Smart Data Insight
Master the Perfect Entry & Exit for this Stock
Don't leave your profits to chance. Historically, this stock follows specific seasonal patterns that institutional traders use to maximize returns.
- ✅ Identify the "Golden Buying Window"
- ✅ Avoid high-risk correction cycles
- ✅ Backtested data from the last 20+ years