
February 27, 2026 a 03:31 pm



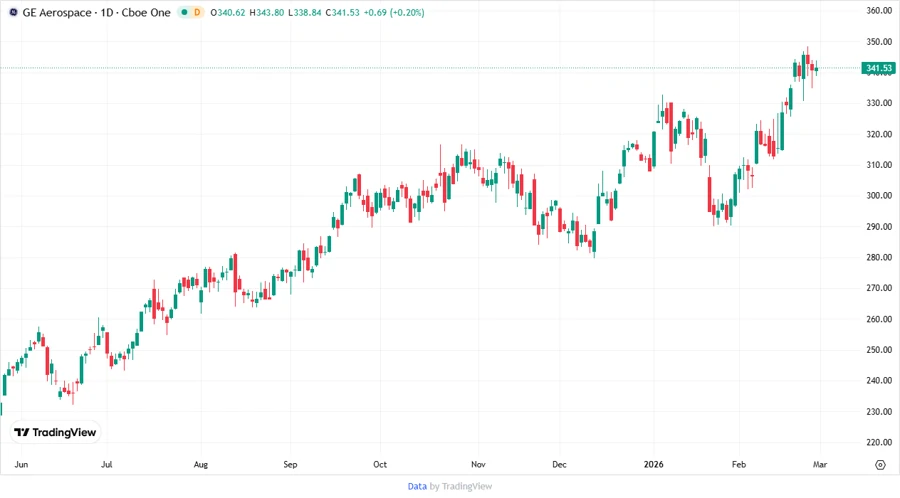
GE: Dividend Analysis - GE Aerospace
GE Aerospace is currently exhibiting stable dividend yield and history. However, the subdued growth rate and relatively low payout ratios suggest limited upside potential for income-focused investors. While its financial health is robust, reflecting strategic reinvestments and prudent fiscal management, the modest dividend growth suggests a conservative capital allocation strategy that prioritizes operational investment over shareholder returns.
📊 Overview
GE Aerospace operates within a diversified sector. The company has demonstrated a consistent dividend history over the past 38 years, which underpins its reliability for income-focused investors. The dividend yield, although modest at 0.45%, highlights its cautious approach to capital returns. Current dividend per share stands at 1.36 USD, with no recent history of dividend cuts or suspensions.
| Metric | Value |
|---|---|
| Sector | Diversified |
| Dividend yield | 0.45% |
| Current dividend per share | 1.36 USD |
| Dividend history | 38 years |
| Last cut or suspension | None |
📈 Dividend History
The dividend history of GE Aerospace shows resilience and commitment to returning value to shareholders through harsh economic cycles. An uninterrupted dividend payment history can amplify investor confidence and influence long-term investment decisions.
| Year | Dividend Per Share |
|---|---|
| 2026 | 0.47 |
| 2025 | 1.44 |
| 2024 | 1.12 |
| 2023 | 0.26 |
| 2022 | 0.20 |
📉 Dividend Growth
The company has experienced a modest dividend growth of 0.93% over 3 years and 0.49% over 5 years. This growth rate reflects a strategy to conserve capital possibly for reinvestment over immediate shareholder payouts. Despite this, the average dividend growth of 0.49% over 5 years indicates a stable, albeit slow, upward trajectory in dividend distribution.
| Time | Growth |
|---|---|
| 3 years | 0.93% |
| 5 years | 0.49% |
✅ Payout Ratio
The EPS-based payout ratio of 16.68% and a Free Cash Flow (FCF) based payout ratio of 19.76% underscore a prudent dividend strategy. Low payout ratios can signal ability to increase dividends or reinvest earnings, lending flexibility during fiscal fluctuations.
| Key Figure | Ratio |
|---|---|
| EPS-based | 16.68% |
| Free cash flow-based | 19.76% |
💰 Cashflow & Capital Efficiency
The Free Cash Flow Yield and Earnings Yield reveal insights into cash generation efficiency, while CAPEX to Operating Cash Flow suggests reinvestment into operations. Stability in these metrics is vital to assessing future financial flexibility and operational investments.
| Metric | 2023 | 2024 | 2025 |
|---|---|---|---|
| Free Cash Flow Yield | 3.23% | 2.03% | 2.21% |
| Earnings Yield | 8.55% | 3.62% | 2.65% |
| CAPEX to Operating Cash Flow | 30.79% | 21.91% | 14.91% |
| Stock-based Compensation to Revenue | 1.02% | 0.09% | 0% |
| Free Cash Flow / Operating Cash Flow Ratio | 69.20% | 78.09% | 85.09% |
Evaluation of cash flow stability and capital efficiency suggests a robust framework for reinvestment opportunities and potential growth in asset value.
📊 Balance Sheet & Leverage Analysis
The balance sheet metrics provide insights into financial leverage and liquidity, essential for analyzing debt levels and operational risk. Current ratio and quick ratio signal the company’s ability to cover short-term liabilities, while the debt ratios reflect on long-term solvency.
| Metric | 2023 | 2024 | 2025 |
|---|---|---|---|
| Debt-to-Equity | 0.79 | 1.05 | 1.10 |
| Debt-to-Assets | 0.12 | 0.16 | 0.16 |
| Debt-to-Capital | 0.44 | 0.51 | 0.52 |
| Net Debt to EBITDA | 0.52 | 0.69 | 0.67 |
| Current Ratio | 1.33 | 1.09 | 1.04 |
| Quick Ratio | 1.07 | 0.81 | 0.74 |
| Financial Leverage | 6.43 | 6.50 | 6.97 |
The firm appears to be maintaining a controlled debt profile, supporting financial resilience in variable economic conditions.
📈 Fundamental Strength & Profitability
The profitability ratios, including Return on Equity and Margins, outline the operational efficiency and cost management. Research and Development investment depicted in the ratios reflect the company’s focus on innovation.
| Metric | 2023 | 2024 | 2025 |
|---|---|---|---|
| Return on Equity | 34.60% | 33.90% | 46.60% |
| Return on Assets | 5.38% | 5.21% | 6.69% |
| Margins: Net | 26.82% | 16.94% | 18.98% |
| EBIT | 32.45% | 22.24% | 23.65% |
| EBITDA | 35.78% | 25.30% | 26.31% |
| Gross | 35.11% | 37.19% | 36.83% |
| Research & Development to Revenue | 2.86% | 3.32% | 3.44% |
These indicators depict a company with strong operational capabilities, exercising efficient cost management and innovative initiatives.
💹 Price Development
🗣️ Dividend Scoring System
| Category | Score (1-5) | Score Bar |
|---|---|---|
| Dividend yield | 2 | |
| Dividend Stability | 5 | |
| Dividend growth | 3 | |
| Payout ratio | 4 | |
| Financial stability | 4 | |
| Dividend continuity | 5 | |
| Cashflow Coverage | 4 | |
| Balance Sheet Quality | 5 |
Total Score: 32/40
⚠️ Rating
GE Aerospace maintains a solid dividend record, characterized by consistent payouts and a moderate, albeit slow, growth trajectory. The company's stable financial foundation, underscored by strong balance sheet metrics and efficient operational management, presents a compelling long-term investment thesis for risk-averse investors seeking steady income and potential capital appreciation. Consequently, it is highly rated for its strategic foresight and disciplined fiscal approach.
Smart Data Insight
Master the Perfect Entry & Exit for this Stock
Don't leave your profits to chance. Historically, this stock follows specific seasonal patterns that institutional traders use to maximize returns.
- ✅ Identify the "Golden Buying Window"
- ✅ Avoid high-risk correction cycles
- ✅ Backtested data from the last 20+ years