November 02, 2025 a 07:47 am

GE: Dividend Analysis - GE Aerospace
GE Aerospace offers a unique dividend profile characterized by a long-standing history of consistent payments, demonstrating the company's commitment to returning capital to shareholders. With a dividend yield of 0.46%, the company’s payouts may not be the highest in the sector but are supported by a solid financial base and a history of 37 years without cuts or suspensions. Investors may find appeal in the stock’s potential for moderate growth, making it a stable choice in turbulent markets.
📊 Overview
The following table provides an overview of key dividend metrics for GE Aerospace, highlighting its sector, current yield, and dividend history.
| Metric | Value |
|---|---|
| Sector | Aerospace |
| Dividend yield | 0.46% |
| Current dividend per share | 0.93 USD |
| Dividend history | 37 years |
| Last cut or suspension | None |
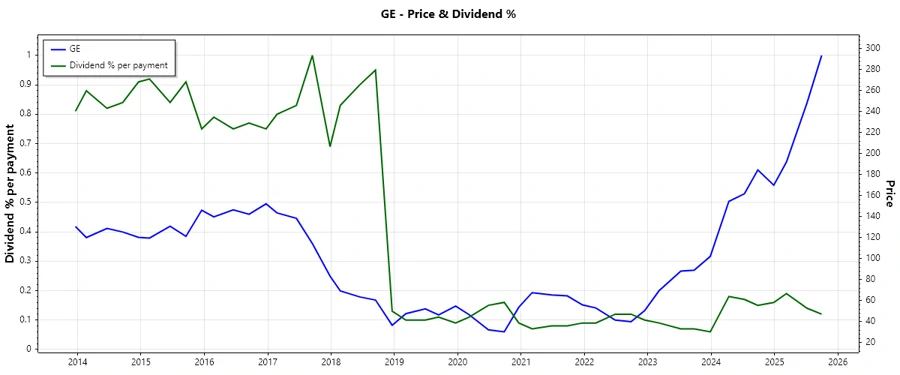
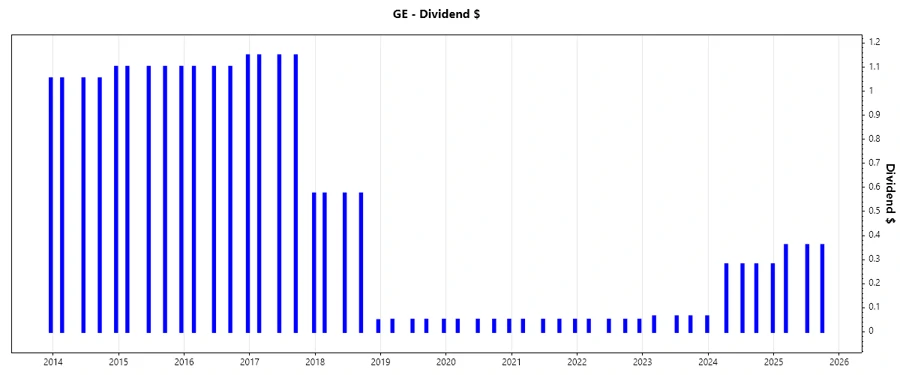
🗣️ Dividend History
Understanding the historical dividend payments is crucial, as it reveals the company's ability to maintain and grow its dividend over time, which can be an indicator of financial strength.
| Year | Dividend per Share (USD) |
|---|---|
| 2025 | 1.08 |
| 2024 | 1.12 |
| 2023 | 0.255 |
| 2022 | 0.199 |
| 2021 | 0.199 |
📈 Dividend Growth
The company's dividend growth over the past few years reflects its financial health and its ability to enhance shareholder value. Consistent growth signals a strongly managed business.
| Time | Growth |
|---|---|
| 3 years | 0.78% |
| 5 years | 0.41% |
The average dividend growth is 0.41% over 5 years. This shows moderate but steady dividend growth, reflecting GE Aerospace's commitment to gradually increasing shareholder returns.
⚠️ Payout Ratio
Payout ratios help gauge the sustainability of dividend payments. They indicate what percentage of earnings and free cash flow are paid out as dividends, thus influential for future cash flow assessments and growth projections.
| Key figure | Ratio |
|---|---|
| EPS-based | 12.30% |
| Free cash flow-based | 15.08% |
The EPS-based payout ratio of 12.30% and FCF-based ratio of 15.08% indicate a conservative payout policy, leaving room for potential future dividend increases without risking financial stability.
✅ Cashflow & Capital Efficiency
Analyzing cash flow data uncovers the company's capability to sustain its dividend and invest in growth. It's a critical indicator of operational efficiency.
| Metric | 2024 | 2023 | 2022 |
|---|---|---|---|
| Free Cash Flow Yield | 2.03% | 3.23% | 8.30% |
| Earnings Yield | 3.62% | 8.55% | 0.59% |
| CAPEX to Operating Cash Flow | 21.91% | 30.80% | 19.84% |
| Stock-based Compensation to Revenue | 0.08% | 1.02% | 0.90% |
| Free Cash Flow / Operating Cash Flow Ratio | 78.08% | 69.20% | 80.16% |
The cash flow stability and positive free cash flow indicate effective capital management, ensuring that dividends are well covered by the company's ongoing operations.
💡 Balance Sheet & Leverage Analysis
The balance sheet reveals the leverage and liquidity positions, critical for understanding the financial strength and risk potential of the company.
| Metric | 2024 | 2023 | 2022 |
|---|---|---|---|
| Debt-to-Equity | 1.05 | 0.79 | 0.78 |
| Debt-to-Assets | 16.20% | 12.36% | 13.85% |
| Debt-to-Capital | 51.30% | 44.27% | 43.69% |
| Net Debt to EBITDA | 0.69 | 0.52 | 2.56 |
| Current Ratio | 1.09 | 1.33 | 1.18 |
| Quick Ratio | 0.81 | 1.07 | 0.88 |
| Financial Leverage | 6.50 | 6.43 | 5.60 |
GE Aerospace maintains a balanced leverage profile, with sufficient liquidity ratios demonstrating its capability to manage debt effectively while supporting ongoing and future business operations.
📉 Fundamental Strength & Profitability
Profitability metrics reveal the efficiency of a company in generating profit relative to its revenue, equity, and assets, serving as a predictor of financial sustainability.
| Metric | 2024 | 2023 | 2022 |
|---|---|---|---|
| Return on Equity | 33.90% | 34.60% | 1.00% |
| Return on Assets | 5.21% | 5.38% | 0.18% |
| Margins: Net | 16.94% | 26.82% | 1.15% |
| EBIT | 22.24% | 32.45% | 9.82% |
| EBITDA | 25.30% | 35.78% | 13.88% |
| Gross | 37.19% | 35.11% | 34.84% |
| Research & Development to Revenue | 3.23% | 2.86% | 2.77% |
The strong return on equity and robust margins reflect operational efficiency and indicate GE Aerospace’s ability to generate substantial profits, adding value to shareholders.
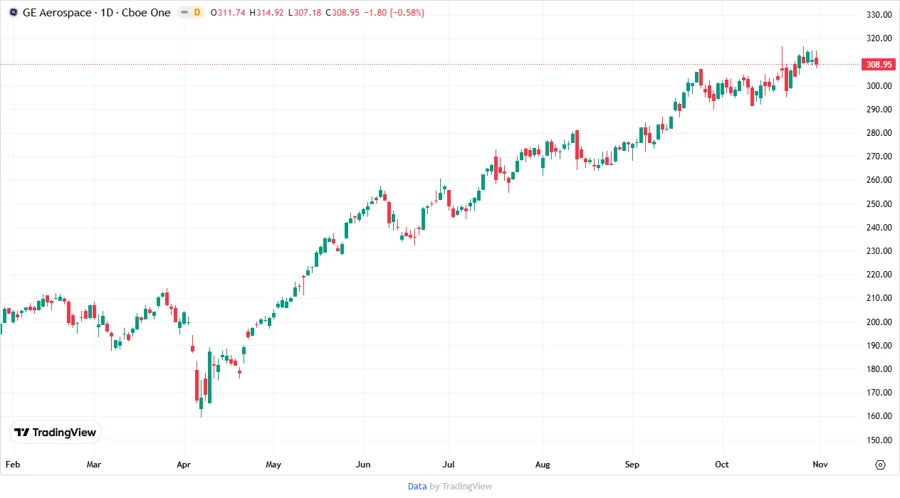
🔝 Price Development
📈 Dividend Scoring System
| Criteria | Points | Score |
|---|---|---|
| Dividend yield | 2 | |
| Dividend Stability | 5 | |
| Dividend growth | 3 | |
| Payout ratio | 4 | |
| Financial stability | 4 | |
| Dividend continuity | 5 | |
| Cashflow Coverage | 4 | |
| Balance Sheet Quality | 4 |
Overall Score: 31 / 40
✅ Rating
Conclusively, GE Aerospace presents a stable investment opportunity due to its admirable dividend stability and financial foundation, ideal for investors seeking steady returns with secure capital through diverse market conditions.
Smart Data Insight
Master the Perfect Entry & Exit for this Stock
Don't leave your profits to chance. Historically, this stock follows specific seasonal patterns that institutional traders use to maximize returns.
- ✅ Identify the "Golden Buying Window"
- ✅ Avoid high-risk correction cycles
- ✅ Backtested data from the last 20+ years