August 16, 2025 a 12:47 pm

GE: Dividend Analysis - GE Aerospace
GE Aerospace has a solid dividend track record with minor fluctuations. With a market capitalization of approximately $284 billion, its financial fundamentals are crucial for sustaining future dividend payouts. The current dividend yield stands at a modest 0.51%, reflecting a relatively safe payout ratio and steady increase in dividends over recent years.
📊 Overview
GE Aerospace operates within a complex aerospace sector, with a profound history of dividend payments spanning 37 years. Despite a conservative dividend yield of 0.51%, it ensures consistent dividends with its robust earnings.
| Key Data | Value |
|---|---|
| Sector | Aerospace |
| Dividend yield | 0.51% |
| Current dividend per share | 0.93 USD |
| Dividend history | 37 years |
| Last cut or suspension | None |
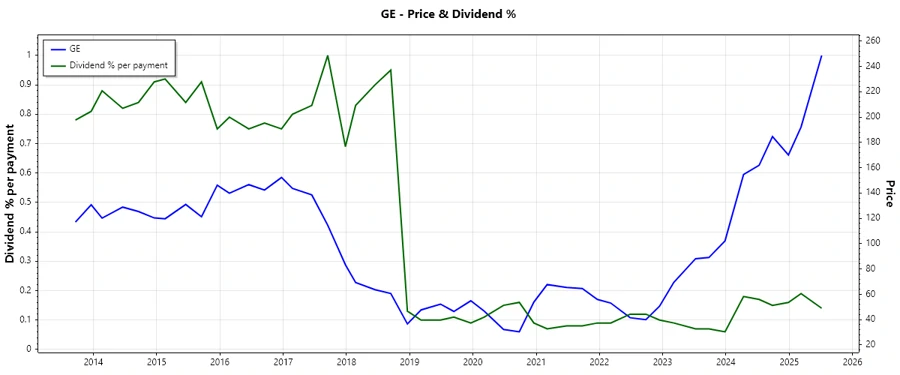
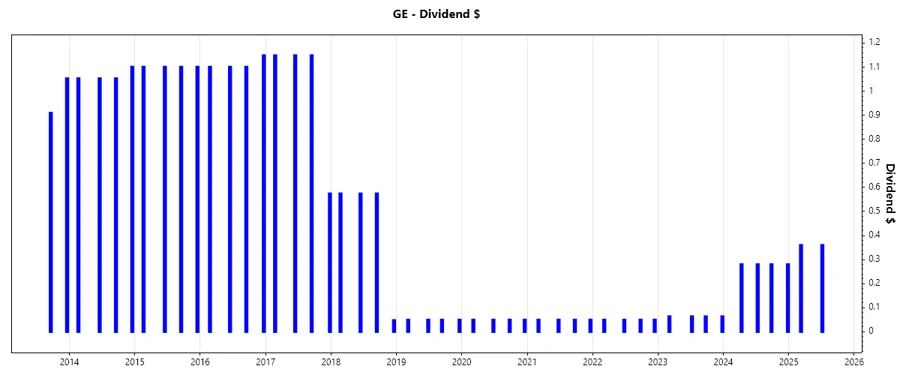
📈 Dividend History
GE's commitment to dividends is evident from its extensive history. The stable dividend regime fosters investor confidence, particularly appealing in volatile market conditions.
| Year | Dividend per Share (USD) |
|---|---|
| 2025 | 0.72 |
| 2024 | 1.12 |
| 2023 | 0.26 |
| 2022 | 0.20 |
| 2021 | 0.20 |
📈 Dividend Growth
The company's dividend growth reflects its long-term profitability and vision to enhance shareholder value.
| Time | Growth |
|---|---|
| 3 years | 0.78% |
| 5 years | 0.41% |
The average dividend growth is 0.41% over 5 years. This shows moderate but steady dividend growth.
🗣️ Payout Ratio
A sustainable payout ratio reassures that the company can maintain its dividend without financial strain.
| Key Figure | Ratio |
|---|---|
| EPS-based | 12.78% |
| Free cash flow-based | 17.94% |
The EPS and FCF payout ratios of 12.78% and 17.94% respectively indicate a conservative payout strategy, leaving room for growth or reinvestment.
💰 Cashflow & Capital Efficiency
Assessing cash flow and capital allocation provides insight into operational efficiency and potential for future growth.
| Metric | 2022 | 2023 | 2024 |
|---|---|---|---|
| Free Cash Flow Yield | 8.30% | 3.23% | 2.03% |
| Earnings Yield | 0.59% | 8.55% | 3.62% |
| CAPEX/Ops. Cash Flow | 19.84% | 30.80% | 21.91% |
| Stock Comp./Revenue | 0.90% | 1.02% | 0.85% |
| FCF/OCF Ratio | 80.16% | 69.20% | 78.09% |
GE Aerospace shows robust cash flow stability with strategic capital expenditure, ensuring long-term capital efficiency.
📊 Balance Sheet & Leverage Analysis
An analysis of leverage ratios illustrates the company’s financial health and its ability to manage existing debt.
| Metric | 2022 | 2023 | 2024 |
|---|---|---|---|
| Debt-to-Equity | 0.78 | 0.79 | 1.05 |
| Debt-to-Assets | 13.85% | 12.36% | 16.20% |
| Debt-to-Capital | 43.69% | 44.27% | 51.30% |
| Net Debt/EBITDA | 2.56 | 0.52 | 0.69 |
| Current Ratio | 1.18 | 1.33 | 1.09 |
| Quick Ratio | 0.88 | 1.07 | 0.81 |
| Fin. Leverage | 5.60 | 6.43 | 6.50 |
The leverage ratios reflect a well-balanced financial structure, providing secure operations with ample debt service capacity.
🏆 Fundamental Strength & Profitability
Analyzing profitability metrics gives a comprehensive sense of the firm's efficiency and market competitiveness.
| Metric | 2022 | 2023 | 2024 |
|---|---|---|---|
| Return on Equity | 0.99% | 34.60% | 33.90% |
| Return on Assets | 0.18% | 5.38% | 5.21% |
| Return on Inv. Capital | 2.23% | 2.93% | 6.31% |
| Margins: Net Profit | 1.15% | 26.82% | 16.94% |
| EBITDA Margin | 13.88% | 35.78% | 25.30% |
| R&D/Revenue | 2.77% | 2.86% | 3.32% |
GE’s high return figures in recent years are indicative of strong profitability and operational excellence.
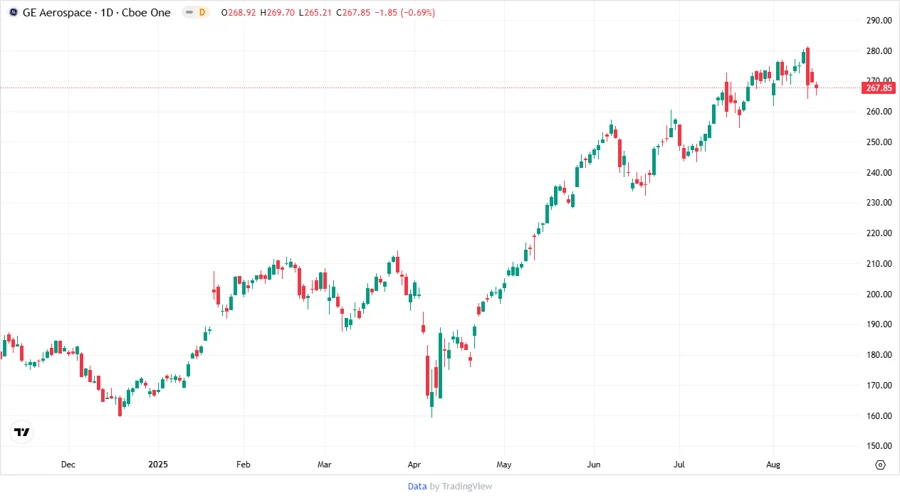
📉 Price Development
✅ Dividend Scoring System
| Criteria | Score | Score Bar |
|---|---|---|
| Dividend yield | 2 | |
| Dividend Stability | 4 | |
| Dividend growth | 3 | |
| Payout ratio | 4 | |
| Financial stability | 5 | |
| Dividend continuity | 5 | |
| Cashflow Coverage | 3 | |
| Balance Sheet Quality | 4 |
Total Score: 30/40
🗣️ Rating
GE Aerospace exhibits a solid dividend profile and reliable financial metrics, meriting a "Buy" rating for investors seeking stability and moderate growth. Its strong cash flow and conservative payout ratio ensure sustainable dividends and potential for future increases.
Smart Data Insight
Master the Perfect Entry & Exit for this Stock
Don't leave your profits to chance. Historically, this stock follows specific seasonal patterns that institutional traders use to maximize returns.
- ✅ Identify the "Golden Buying Window"
- ✅ Avoid high-risk correction cycles
- ✅ Backtested data from the last 20+ years