August 07, 2025 a 03:31 pm


GE: Dividend Analysis - GE Aerospace
General Electric's dividend profile shows a commitment to shareholder returns through consistent payments with a modest dividend yield of 0.51%. As the company continues its transformation, the focus on dividend stability becomes crucial to reassure investors about its financial health and future growth prospects.
📊 Overview
GE Aerospace has a long-standing reputation in the sector, providing promising opportunities for dividend-focused investors. The company's dividend yield remains low compared to peers in the industry, but the long dividend history and recent adjustments in their dividend payout exhibit a strong commitment to maintaining dividends.
| Metric | Value |
|---|---|
| Sector | Aerospace |
| Dividend yield | 0.51% |
| Current dividend per share | 0.93 USD |
| Dividend history | 37 years |
| Last cut or suspension | None |
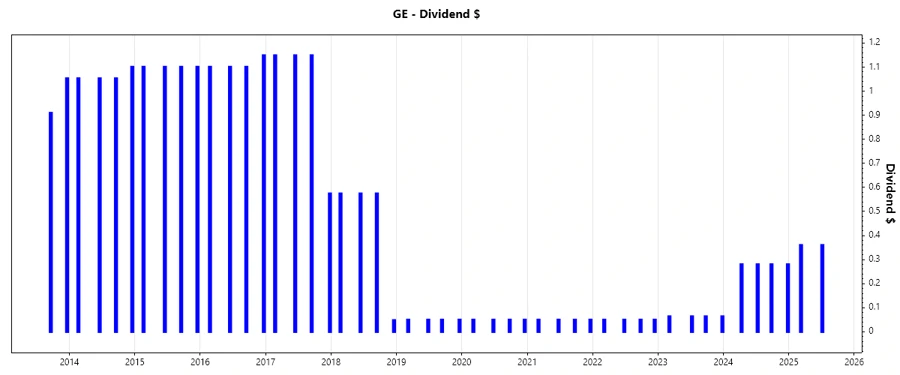
📈 Dividend History
The historical dividend performance of GE illustrates resilience and commitment to shareholders in turbulent times. The consistency over the years establishes trust, critical for long-term investors focusing on dividends. Recent years reflect a strategic adaptation to market conditions.
| Year | Dividend per Share (USD) |
|---|---|
| 2025 | 0.72 |
| 2024 | 1.12 |
| 2023 | 0.26 |
| 2022 | 0.20 |
| 2021 | 0.20 |
🌱 Dividend Growth
Evaluating the dividend growth provides insight into the company's capacity to enhance shareholder value over time. GE's growth over the past few years has been moderate, reflecting strategic reinvestments to support sustainable long-term growth.
| Time | Growth |
|---|---|
| 3 years | 0.78% |
| 5 years | 0.41% |
The average dividend growth is 0.41% over 5 years. This shows moderate but steady dividend growth.
🔍 Payout Ratio
The payout ratios reveal whether a company can sustain its dividend payments from its earnings or cash flow. With GE's EPS-based payout at 12.78% and FCF-based payout at 17.94%, there's a significant buffer, indicating room for potential dividend increases.
| Key figure | Ratio |
|---|---|
| EPS-based | 12.78% |
| Free cash flow-based | 17.94% |
GE's low payout ratios represent a conservative approach, allowing flexibility in uncertain market environments and providing protection for dividends during downturns.
💰 Cashflow & Capital Efficiency
Examining cash flows and capital efficiency metrics is critical in assessing the underlying financial health and the company’s ability to fund dividend payouts. CFC ratios and substantial yields demonstrate GE's capacity to sustain and possibly augment its dividend strategy in fluctuating markets.
💼 Balance Sheet & Leverage Analysis
A robust balance sheet with controlled leverage ratios underpins GE's financial stability. These metrics are pivotal for evaluating risk exposure and the potential for supporting consistent dividend payouts while still allowing for strategic investments.
📊 Fundamental Strength & Profitability
GE's fundamental metrics exhibit positive returns, indicating effective management and profitable operations. These indicators are vital for sustained dividend growth as they reflect efficiency in generating returns for shareholders.
📈 Price Development
📊 Dividend Scoring System
An individual dividend scoring system evaluates key dividend performance aspects to derive a comprehensive score.
| Criteria | Score | |
|---|---|---|
| Dividend yield | 2 | |
| Dividend Stability | 4 | |
| Dividend growth | 3 | |
| Payout ratio | 4 | |
| Financial stability | 4 | |
| Dividend continuity | 5 | |
| Cashflow Coverage | 3 | |
| Balance Sheet Quality | 4 |
Total Score: 29/40
🗣️ Rating
GE Aerospace presents a mixed but promising dividend profile. It maintains stability with cautious payout ratios and positive growth prospects amidst a transforming business model. The moderate yield should be improved; nonetheless, it is supported by a robust financial foundation suggesting a reliable dividend-paying potential. Investors seeking consistent returns with potential for longer-term growth may find GE suitable for their portfolio.
Smart Data Insight
Master the Perfect Entry & Exit for this Stock
Don't leave your profits to chance. Historically, this stock follows specific seasonal patterns that institutional traders use to maximize returns.
- ✅ Identify the "Golden Buying Window"
- ✅ Avoid high-risk correction cycles
- ✅ Backtested data from the last 20+ years