June 05, 2026 a 02:03 pm


GEV: Trend and Support & Resistance Analysis - GE Vernova Inc.
GE Vernova Inc. is involved in a diversified energy business, operating through its Power, Wind, and Electrification segments. In recent months, its stock has seen dynamic movements with notable trends indicating shifts in market sentiment. Investors are closely watching the performance amid the global transition towards renewable energy, which influences GE Vernova's markets significantly.
Trend Analysis
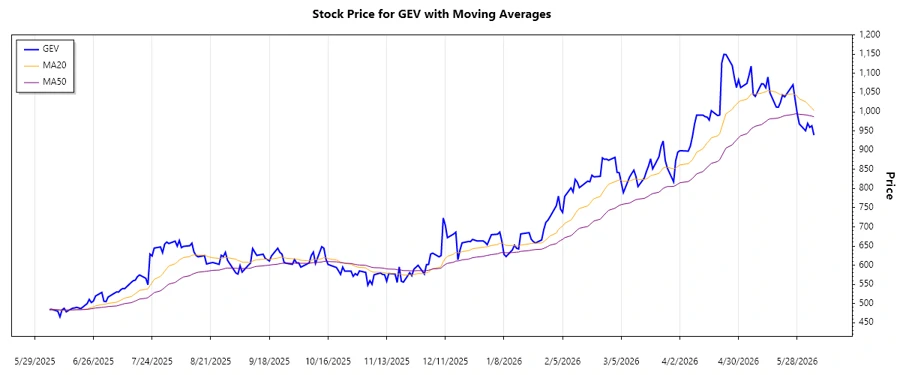
The recent analysis of GE Vernova Inc. indicates a complex pattern of price movements. By calculating the EMA20 and EMA50, we notice the shifting dynamics in the stock's trend. Over the last few months, it appears there was a mixture of upward and downward pressures.
| Date | Closing Price | Trend |
|---|---|---|
| June 5, 2026 | $939.01 | ▼ Downtrend |
| June 4, 2026 | $963.33 | ▼ Downtrend |
| June 3, 2026 | $959.36 | ▼ Downtrend |
| June 2, 2026 | $969.67 | ▲ Uptrend |
| June 1, 2026 | $950.54 | ▼ Downtrend |
| May 29, 2026 | $968.32 | ▲ Uptrend |
| May 28, 2026 | $996.00 | ▲ Uptrend |
The interpretation of these trends highlights a recent dominant downward trend, indicating a possible bearish sentiment, which could be a reflection of broader market conditions or company-specific news.
Support- and Resistance
In reviewing the recent data, the identification of support and resistance zones is crucial for understanding potential price reversals or continuations. Based on historic pricing levels, two primary support and resistance zones are evident.
| Zone Type | From | To |
|---|---|---|
| Support | $900.00 | $950.00 |
| Support | $800.00 | $850.00 |
| Resistance | $1000.00 | $1050.00 |
| Resistance | $1100.00 | $1150.00 |
Currently, the stock price is hovering near the lower support zone, suggesting potential buying interest at these levels. However, should it break below, the next level of support is substantially lower.
Conclusion
The overall analysis of GEV stock indicates some potential opportunities and risks. The recent downtrend suggests caution, although the proximity to support levels could provide buying interest. Resistance zones indicate potential profit-taking areas should the stock rise. GE Vernova's market is volatile due to numerous factors, including developments in renewable energy. Investors should keep an eye on market signals and broader economic indicators that may impact future price movements.
Smart Data Insight
Master the Perfect Entry & Exit for this Stock
Don't leave your profits to chance. Historically, this stock follows specific seasonal patterns that institutional traders use to maximize returns.
- ✅ Identify the "Golden Buying Window"
- ✅ Avoid high-risk correction cycles
- ✅ Backtested data from the last 20+ years