April 29, 2026 a 08:15 am

GEN: Trend and Support & Resistance Analysis - Gen Digital Inc.
The stock of Gen Digital Inc. has shown varied trends over the recent months, indicating volatility influenced by multiple factors. The company’s focus on cybersecurity solutions makes it a vital player in the rapidly growing market for online security services. However, recent market pressures have affected its stock performance, which could present potential opportunities and risks for investors.
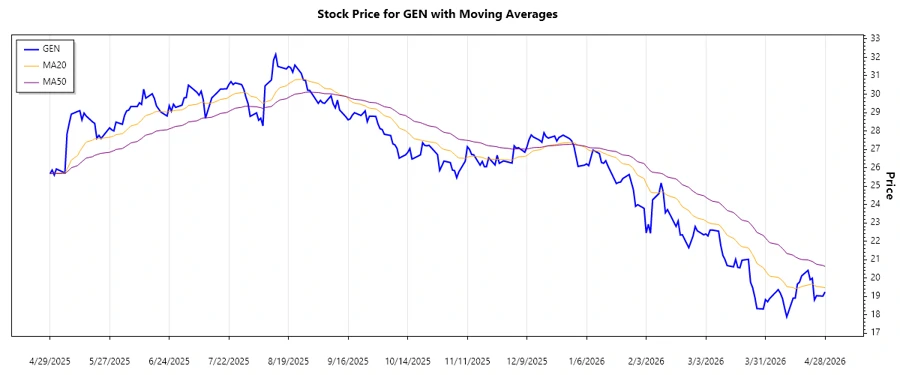
Trend Analysis
Over the analyzed period, Gen Digital Inc.'s stock has experienced significant fluctuations. Using the EMA calculation, we observe:
| Date | Closing Price | Trend |
|---|---|---|
| 2026-04-28 | $19.25 | ▼ |
| 2026-04-27 | $19.02 | ▼ |
| 2026-04-24 | $19.04 | ▼ |
| 2026-04-23 | $18.81 | ▼ |
| 2026-04-22 | $19.99 | ▼ |
| 2026-04-21 | $19.91 | ▼ |
| 2026-04-20 | $20.42 | ▼ |
The EMA20 is consistently below EMA50, indicating a ▼ downward trend.
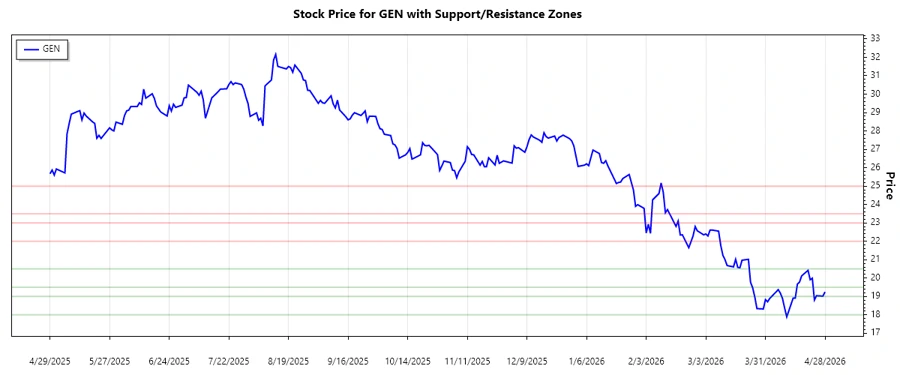
Support- and Resistance
From the historical data analyzed, the stock illustrates significant support and resistance zones:
| Zone Type | Range |
|---|---|
| Support 1 | $18.00 - $19.00 ▼ |
| Support 2 | $19.50 - $20.50 ▼ |
| Resistance 1 | $22.00 - $23.00 ▲ |
| Resistance 2 | $23.50 - $25.00 ▲ |
Currently, the stock is near the Support 1 zone which could indicate potential buying interest.
Conclusion
Gen Digital Inc.'s stock displays a current downward trend, presenting risks as it tests its support zones. While the support zones provide a buffer, a breakthrough below could lead to further declines. Conversely, successful support holds could offer lucrative opportunities for rebound trading. The cybersecurity sector’s growth creates long-term bullish potential for disciplined investors, while short-term volatility remains a principal risk. Analyst interpretations must consider these dynamic market conditions when shaping investment decisions.