June 13, 2026 a 07:31 am


📊 GEN: Dividend Analysis - Gen Digital Inc.
Gen Digital Inc, with a moderate dividend yield, showcases stable dividend payments over the years. However, recent performance highlights a lack of dividend growth, urging investors to consider stability over growth in their investment strategy.
🗣️ Overview
Gen Digital Inc. operates within a competitive sector, maintaining a dividend yield of 2.05%, indicating steady income potential for shareholders. The company has consistently provided dividends over the past 14 years, signifying a commitment to reward its shareholders, with no recent dividend cuts or suspensions.
| Metric | Value |
|---|---|
| Sector | Technology |
| Dividend yield | 2.0542% |
| Current dividend per share | $0.51 |
| Dividend history | 14 years |
| Last cut or suspension | None |
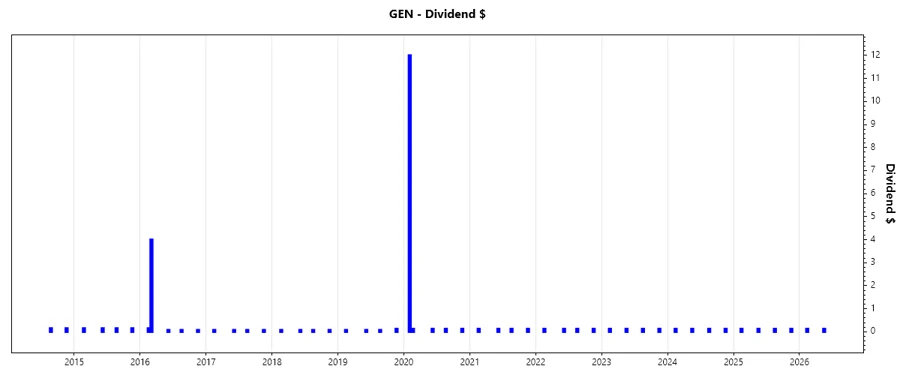
📈 Dividend History
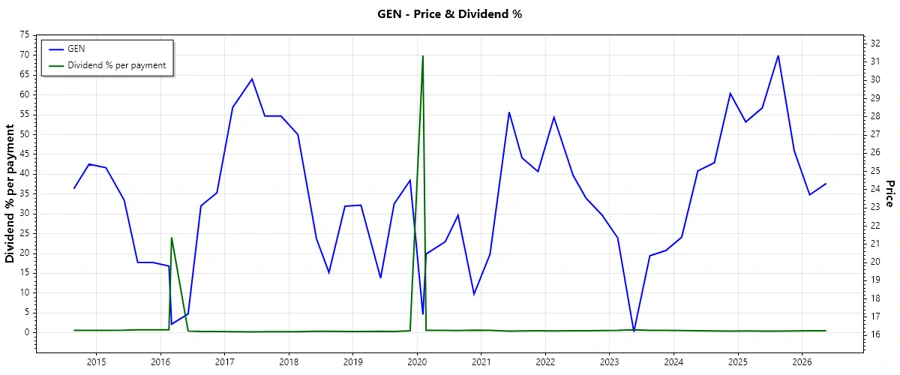
The dividend history of Gen Digital Inc. is a testament to the company's dedication to returning value to its investors. With regular distributions, the company assures its stakeholders of a stable return, crucial for long-term planning.
| Year | Dividend per Share (USD) |
|---|---|
| 2026 | 0.250 |
| 2025 | 0.500 |
| 2024 | 0.500 |
| 2023 | 0.500 |
| 2022 | 0.500 |
📊 Dividend Growth
The company's dividend growth has been stagnant in the short term, with a negative growth rate over five years, pointing to a stable yet non-growing dividend policy.
| Time | Growth |
|---|---|
| 3 years | 0% |
| 5 years | -0.47% |
The average dividend growth is -0.47% over 5 years. This shows a decline in dividend growth, emphasizing the necessity for strategic realignment to spur dividend increments.
⚠️ Payout Ratio
The payout ratio, a crucial indicator of dividend sustainability, reveals the proportion of earnings paid out as dividends. Gen Digital Inc. maintains low payout ratios, suggesting a balanced approach to profit distribution.
| Key figure ratio | Percentage |
|---|---|
| EPS-based | 31.54% |
| Free cash flow-based | 20.17% |
A 31.54% EPS payout ratio and a 20.17% FCF ratio indicate room for dividend increases, presenting a prudent cash reserve strategy.
💰 Cashflow & Capital Efficiency
Robust cash flows underpin Gen Digital’s operational efficiency and strategic capital allocation. Monitoring cash flow metrics is vital to ensure liquidity for ongoing operations and shareholder distributions.
| Metric | 2026 | 2025 | 2024 |
|---|---|---|---|
| Free Cash Flow Yield | 10.40% | 7.39% | 14.32% |
| Earnings Yield | 6.65% | 3.94% | 4.25% |
| CAPEX to Operating Cash Flow | 1.42% | 1.23% | 0.97% |
| Stock-based Compensation to Revenue | 3.50% | 3.40% | 3.63% |
| Free Cash Flow / Operating Cash Flow Ratio | 98.6% | 98.7% | 99.0% |
The above metrics suggest that cash generation remains robust, supporting dividend strategies and investment in growth opportunities.
💼 Balance Sheet & Leverage Analysis
Understanding the leverage and liquidity metrics is crucial to ascertain the financial resilience and borrowing capacity of Gen Digital Inc.
| Metric | 2026 | 2025 | 2024 |
|---|---|---|---|
| Debt-to-Equity | 3.16 | 3.66 | 4.04 |
| Debt-to-Assets | 52.99% | 53.66% | 54.80% |
| Debt-to-Capital | 75.98% | 78.56% | 80.18% |
| Net Debt to EBITDA | 3.40 | 3.61 | 4.88 |
| Current Ratio | 0.40 | 0.51 | 0.50 |
| Quick Ratio | 0.40 | 0.51 | 0.50 |
| Financial Leverage | 5.97 | 6.83 | 7.38 |
These figures reflect moderate leverage, which should be balanced against liquidity to mitigate financial risk.
📈 Fundamental Strength & Profitability
Profitability and efficiency metrics shed light on Gen Digital's operational viability, critical for evaluating its ability to sustain and increase dividends.
| Metric | 2026 | 2025 | 2024 |
|---|---|---|---|
| Return on Equity | 37.27% | 28.34% | 28.36% |
| Return on Assets | 6.24% | 4.15% | 3.84% |
| Net Margin | 19.46% | 16.34% | 15.97% |
| EBIT Margin | 18.84% | 40.84% | 29.37% |
| EBITDA Margin | 28.70% | 51.49% | 42.13% |
| Gross Margin | 74.10% | 80.28% | 80.76% |
| Research & Development to Revenue | 8.18% | 8.36% | 8.74% |
Profitability metrics are solid, implying efficient operations despite competitive pressure, affirming Gen Digital's capability to support dividend payments.
💹 Price Development
✅ Dividend Scoring System
| Criterion | Score | Indicator |
|---|---|---|
| Dividend yield | 3 | |
| Dividend Stability | 4 | |
| Dividend growth | 2 | |
| Payout ratio | 4 | |
| Financial stability | 3 | |
| Dividend continuity | 5 | |
| Cashflow Coverage | 4 | |
| Balance Sheet Quality | 3 |
Total Score: 28/40
🗣️ Final Rating
Gen Digital Inc. presents a compelling dividend profile with stable yet non-increasing dividends. The current financial metrics show sound payout capabilities and a stable balance sheet. While recent growth is lacking, the company's strong payout consistency makes it a viable option for income-focused investors seeking moderate risk. Overall, Gen Digital Inc. is a "Hold" for cautious investors prioritizing dividend stability.
Smart Data Insight
Master the Perfect Entry & Exit for this Stock
Don't leave your profits to chance. Historically, this stock follows specific seasonal patterns that institutional traders use to maximize returns.
- ✅ Identify the "Golden Buying Window"
- ✅ Avoid high-risk correction cycles
- ✅ Backtested data from the last 20+ years