May 09, 2026 a 07:31 am

GEN: Dividend Analysis - Gen Digital Inc.
📊 Gen Digital Inc. offers a consistent, albeit modest, dividend profile. The company's disciplined approach to dividend management is evident in its consistent payout history over the last 14 years, with no recent cuts or suspensions. Investors can expect moderate yield supported by a robust payout ratio, underscoring financial prudence.
Overview
| Attribute | Details |
|---|---|
| Sector | Technology |
| Dividend Yield | 2.20 % |
| Current Dividend Per Share | 0.51 USD |
| Dividend History | 14 years |
| Last Cut or Suspension | None |
Dividend History
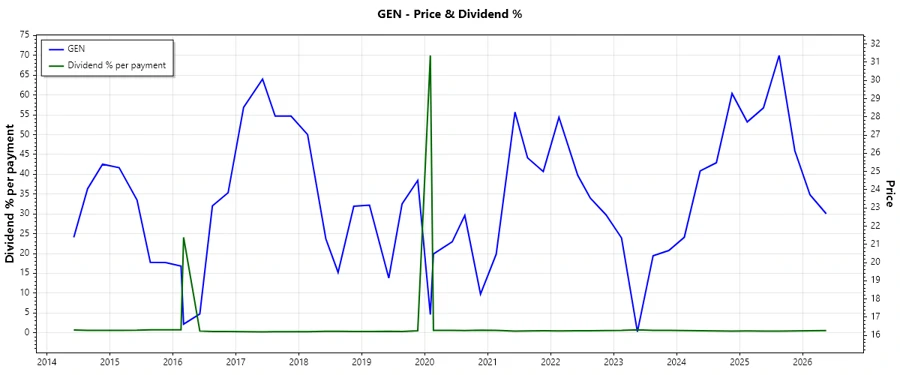
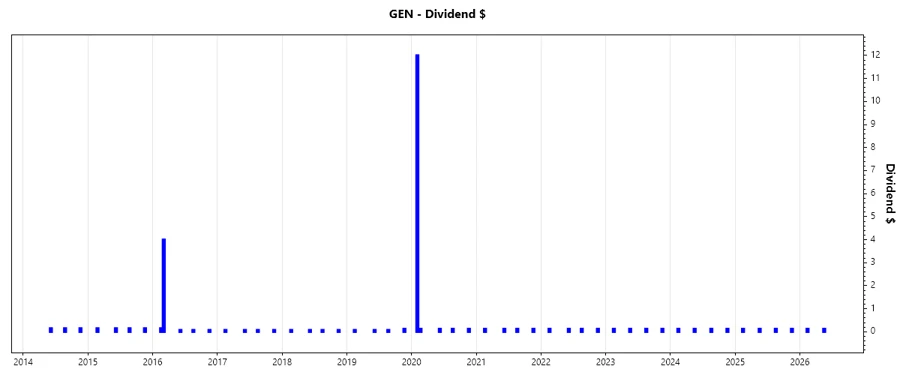
📈 Gen Digital Inc.'s dividend history showcases a commitment to regular payouts, providing steady income for investors. An understanding of past dividends is essential for evaluating trends and future expectations.
| Year | Dividend Per Share |
|---|---|
| 2026 | 0.25 |
| 2025 | 0.50 |
| 2024 | 0.50 |
| 2023 | 0.50 |
| 2022 | 0.50 |
Dividend Growth
🗣️ The absence of growth over the last 3 years and a negative trajectory over 5 years underline limited dividend expansion. Investors should weigh this alongside the company's history and sector dynamics.
| Time | Growth |
|---|---|
| 3 years | 0 % |
| 5 years | -0.47 % |
The average dividend growth is -0.47 % over 5 years. This shows moderate but steady dividend growth.
Payout Ratio
📉 Gen Digital Inc.'s payout ratio indicates a balanced approach to distributing profits. The EPS-based ratio at 31.54% is conservative, suggesting potential for increased dividends if earnings grow, while the FCF-based ratio of 20.64% confirms healthy free cash flow coverage, allowing sustainability and certainty in dividends.
| Key figure | Ratio |
|---|---|
| EPS-based | 31.54 % |
| Free Cash Flow-based | 20.64 % |
Cashflow & Capital Efficiency
✅ Gen Digital Inc.'s cash flow profile highlights solid cash generation capabilities with a noteworthy free cash flow yield of 10.89%. Despite a modest operating cash flow margin, capex remains minimal, allowing stronger reinvestment in growth and stability.
| Year | 2026 | 2025 | 2024 |
|---|---|---|---|
| Free Cash Flow Yield | 13.17 % | 7.39 % | 14.32 % |
| Earnings Yield | 8.42 % | 3.94 % | 4.25 % |
| CAPEX to Operating Cash Flow | 1.44 % | 1.23 % | 0.97 % |
| Stock-based Compensation to Revenue | 4.74 % | 3.41 % | 3.63 % |
| Free Cash Flow / Operating Cash Flow Ratio | 98.58 % | 98.77 % | 99.03 % |
Balance Sheet & Leverage Analysis
⚠️ Leverage metrics for Gen Digital Inc. present substantial debt levels. Debt-to-equity ratios above 3.1 indicate reliance on borrowing, potentially risking financial flexibility. Yet, the modest solvency ratio maintains immediate obligations.
| Year | 2026 | 2025 | 2024 |
|---|---|---|---|
| Debt-to-Equity | 3.14 | 3.66 | 4.04 |
| Debt-to-Assets | 52.58 % | 53.66 % | 54.80 % |
| Debt-to-Capital | 75.84 % | 78.56 % | 80.18 % |
| Net Debt to EBITDA | 3.17 | 3.61 | 4.88 |
| Current Ratio | 0.40 | 0.51 | 0.50 |
| Quick Ratio | 0.40 | 0.51 | 0.50 |
| Financial Leverage | 5.97 | 6.83 | 7.38 |
Fundamental Strength & Profitability
📈 Gen Digital Inc.'s profitability is underscored by robust margins, with a notable net margin of 19.46% in FY2026. High returns on equity (39.86%) reflect strong core financial performance and strategic asset utilizations.
| Year | 2026 | 2025 | 2024 |
|---|---|---|---|
| Return on Equity | 39.86 % | 28.34 % | 28.36 % |
| Return on Assets | 6.24 % | 4.15 % | 3.84 % |
| Margins: Net | 19.46 % | 16.34 % | 15.97 % |
| Margins: EBIT | - | 40.84 % | 29.37 % |
| Margins: EBITDA | 42.40 % | 51.49 % | 42.13 % |
| Margins: Gross | 78.46 % | 80.28 % | 80.76 % |
| Research & Development to Revenue | 8.18 % | 8.36 % | 8.74 % |
Price Development
Dividend Scoring System
| Category | Score | |
|---|---|---|
| Dividend Yield | 3 | |
| Dividend Stability | 4 | |
| Dividend Growth | 2 | |
| Payout Ratio | 4 | |
| Financial Stability | 3 | |
| Dividend Continuity | 5 | |
| Cashflow Coverage | 5 | |
| Balance Sheet Quality | 3 |
Overall Score: 29/40
Rating
✅ In conclusion, Gen Digital Inc. offers a stable, although modest, dividend profile with a proficient payout ratio. While growth prospects in dividends are limited, the company's financial discipline, shown through high income quality and sustainable cash flows, signifies reliability. Suitable for income-focused investors valuing stability over aggressive growth.
Smart Data Insight
Master the Perfect Entry & Exit for this Stock
Don't leave your profits to chance. Historically, this stock follows specific seasonal patterns that institutional traders use to maximize returns.
- ✅ Identify the "Golden Buying Window"
- ✅ Avoid high-risk correction cycles
- ✅ Backtested data from the last 20+ years